
Case Studies
Case Studies. The Whole Record.
Every ticker that showed up on both scanners goes in here, the ones that ran and the ones that went nowhere. Nothing gets left out because it looks bad.
On a side note: the Momentum Radar works on its own, and it builds a fresh list of tickers every day. I only pick one or two of them to trade each day, whether or not they ever show up on Predictive Intelligence. So this page does not mean I only take stocks that appear on both scanners at the same time, or that the scanners have to agree before there is a trade. The purpose of these case studies is to show how the software works together: how an early flag on Predictive Intelligence and a move on the Momentum Radar line up, and when that combination is worth acting on and when it isn’t.
- Left side: setups that played out
- Right side: setups that didn't
Each one shows what the scanners saw at the time and what happened next.
Matched on both scanners and gave a 20%+ move to scalp.
DKI
Darklris Inc
6–8 Oct 2026
WORKED FOR SCALPING
WOULD NOT HAVE WORKED AS A HOLD
 Click to enlarge
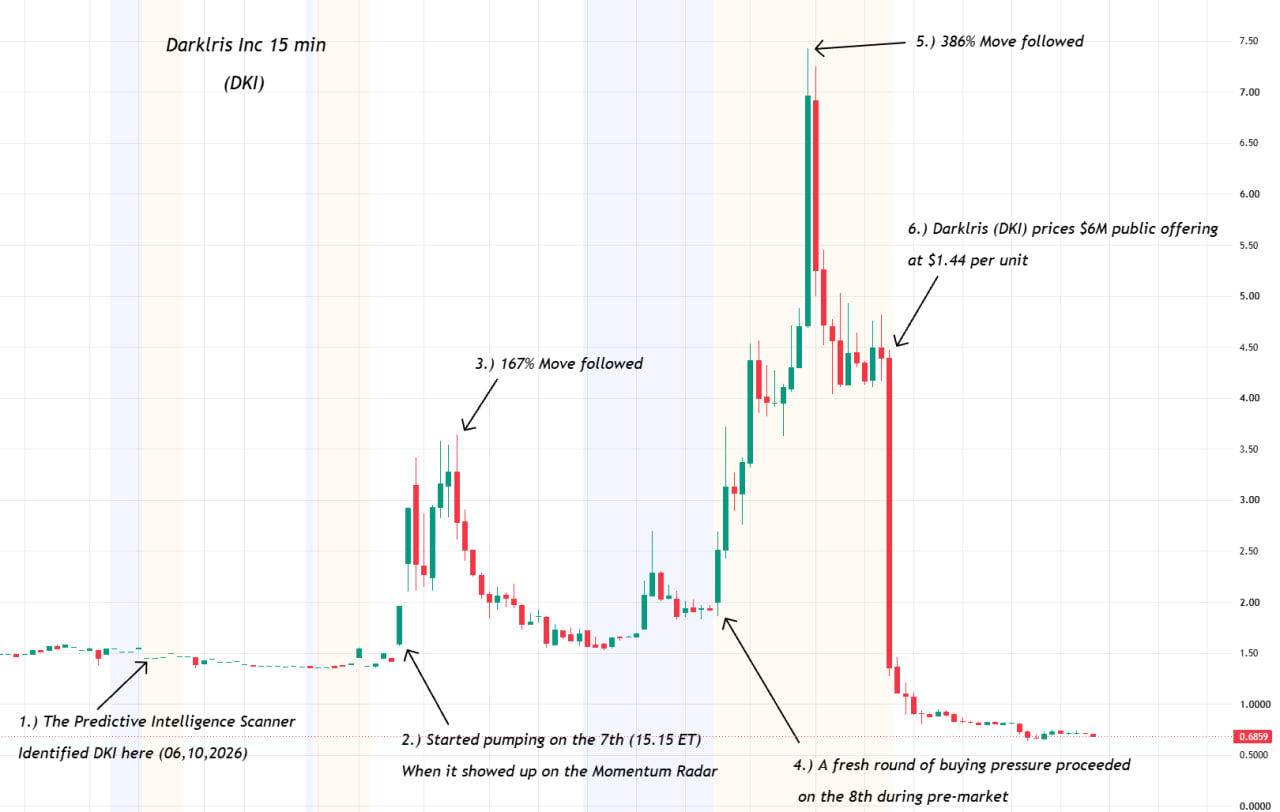
15-minute chart via TradingView. Annotations are mine.
Percentages are read from the chart the way a broker shows them: they start from the after-hours session and roll into pre-market.
- 6 Oct. The Predictive Intelligence scanner identifies DKI.
- 7 Oct, 15:15 ET. It starts pumping and shows up on the Momentum Radar.
- A 167% move follows.
- 8 Oct, pre-market. A fresh round of buying pressure comes in.
- A 386% move follows.
- DKI prices a $6M public offering at $1.44 per unit, and the price falls away.

Predictive Intelligence: DKI on the ladder, dated 06 Oct.
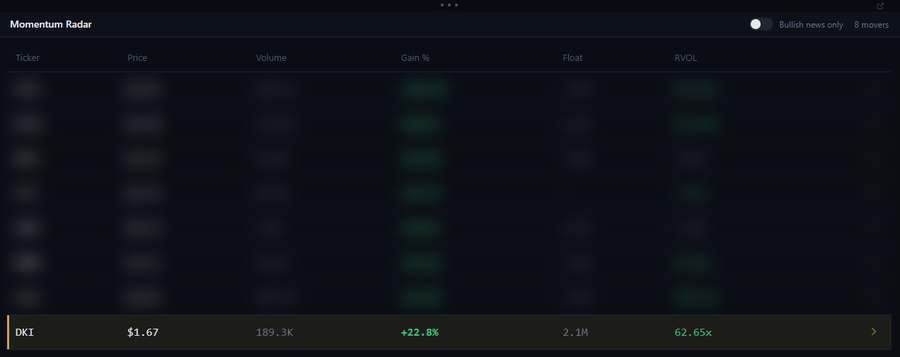
Momentum Radar: DKI among the movers. The other tickers are blurred.
This case study was caught while I was still building the software, before it went live on real-time, low-latency data. So the price, gain %, volume and float on these screenshots are not exact. What they show is that DKI was on both scanners, which is the point of this case study. Once the software is live on real-time data, the case studies on this page will show the real figures.
What this shows: both scanners had it, and the move was there twice for a scalper to trade: first after the Radar flag on the 7th, then again in pre-market on the 8th. Then the offering priced and it gave all of it back, and more. The chart ends at less than half of where Predictive Intelligence first flagged it, so anyone holding from that first flag would have been deeply underwater. That's why this software is built for scalping. It worked for scalping. It would not have worked for holding.
MEDS
DataMeds AI, Inc.
12 Oct 2026
WORKED FOR SCALPING
BEARISH FILING: SMALLER SIZE
 Click to enlarge
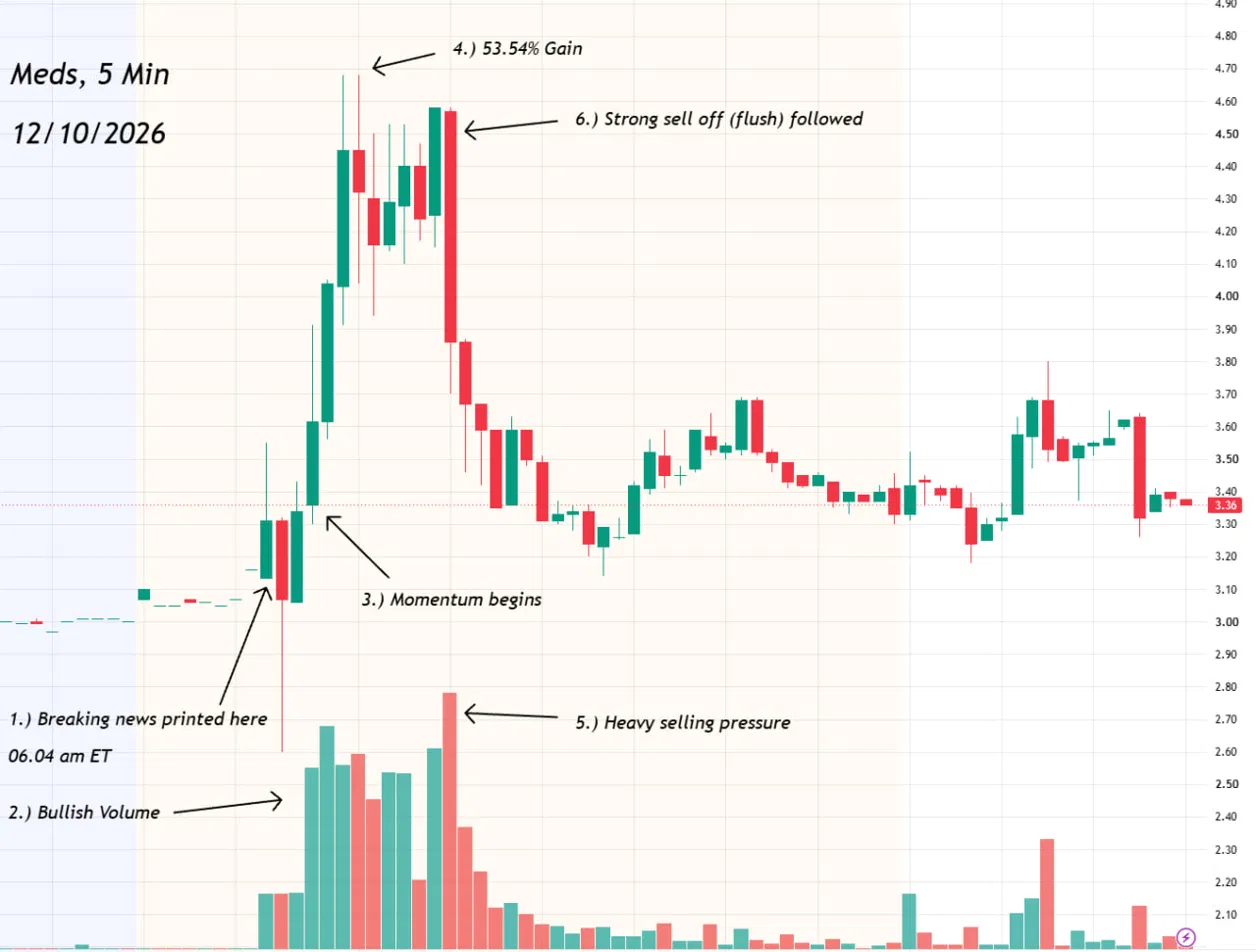
5-minute chart via TradingView. Annotations are mine.
- 12 Oct, 06:04 ET. Breaking news prints and MEDS comes up on the Momentum Radar: Helomics, a DataMeds AI subsidiary, receives a Medicaid coverage determination for the ChemoFx assay in gynecologic cancers.
- Bullish volume comes in.
- Momentum begins.
- The chart runs +53.54%.
- Heavy selling pressure arrives.
- A strong sell-off, the flush, follows.

The breaking news, 06:04 ET. This line came from a different source (see the note below).
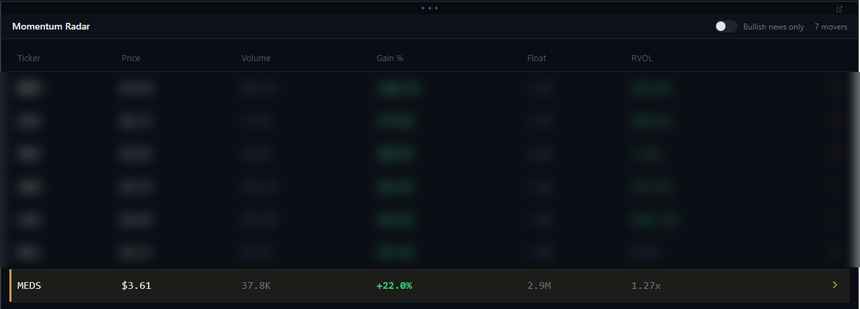
Momentum Radar: MEDS among the movers. The other tickers are blurred.

Predictive Intelligence: MEDS on the ladder, dated 12 Oct, event S-1/A. The price, volume and gain % here are from a different moment than the Radar screenshot, so they don't match. The row to look at is the filing: SEC, S-1/A, score 14.8.
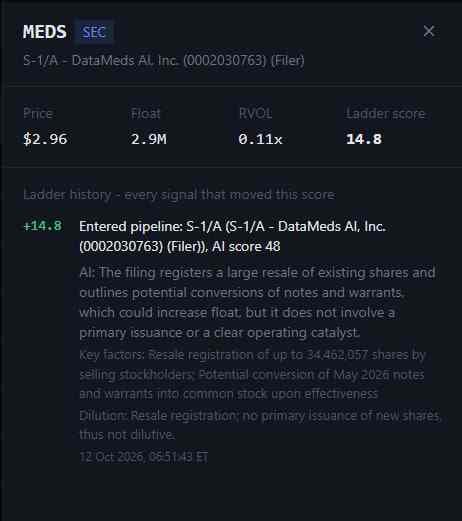
The ladder history for MEDS: what the filing says and what the AI made of it.
This case study was caught while I was still building the software. The news feed is still under development and is not yet running on real-time data, so the news line above was taken from a different source, and the screenshots were captured at different moments. The price, gain %, volume and RVOL on them are not exact and do not match from one screenshot to the next. That is why the Radar shows +22% while the chart shows the full +53.54% move, and why the Predictive row shows a different price again. What they show is that MEDS was on both scanners, which is the point of this case study. Once the software is live on real-time data, the case studies on this page will show the real figures.
What this shows: both scanners had it, and the run was there for a scalper to trade. The news printed at 06:04 ET, bullish volume came in, momentum began and the chart ran 53.54% before heavy selling pressure arrived and a strong flush followed. But this one is a double-edged sword. The filing on the Predictive Intelligence ladder was an S-1/A registering the resale of up to 34,462,057 shares by selling stockholders, with the potential conversion of notes and warrants into common stock. The company is not issuing new shares in it, but supply like that can weigh on a stock, and the flush may well have been related to it. Many retail traders only ever see the headline and never see the filing. That is exactly why the two scanners sit side by side. Knowing about the filing, I would have traded this with a smaller share size, and treated it as a quick scalp to the upside, with caution. It worked for a scalp. This is a record of what the scanners showed, not a signal or a promise.
TDIC
Dreamland Ltd
13–14 Oct 2026
WORKED FOR SCALPING
KNOWN GAP: FORM 4 NOT PICKED UP
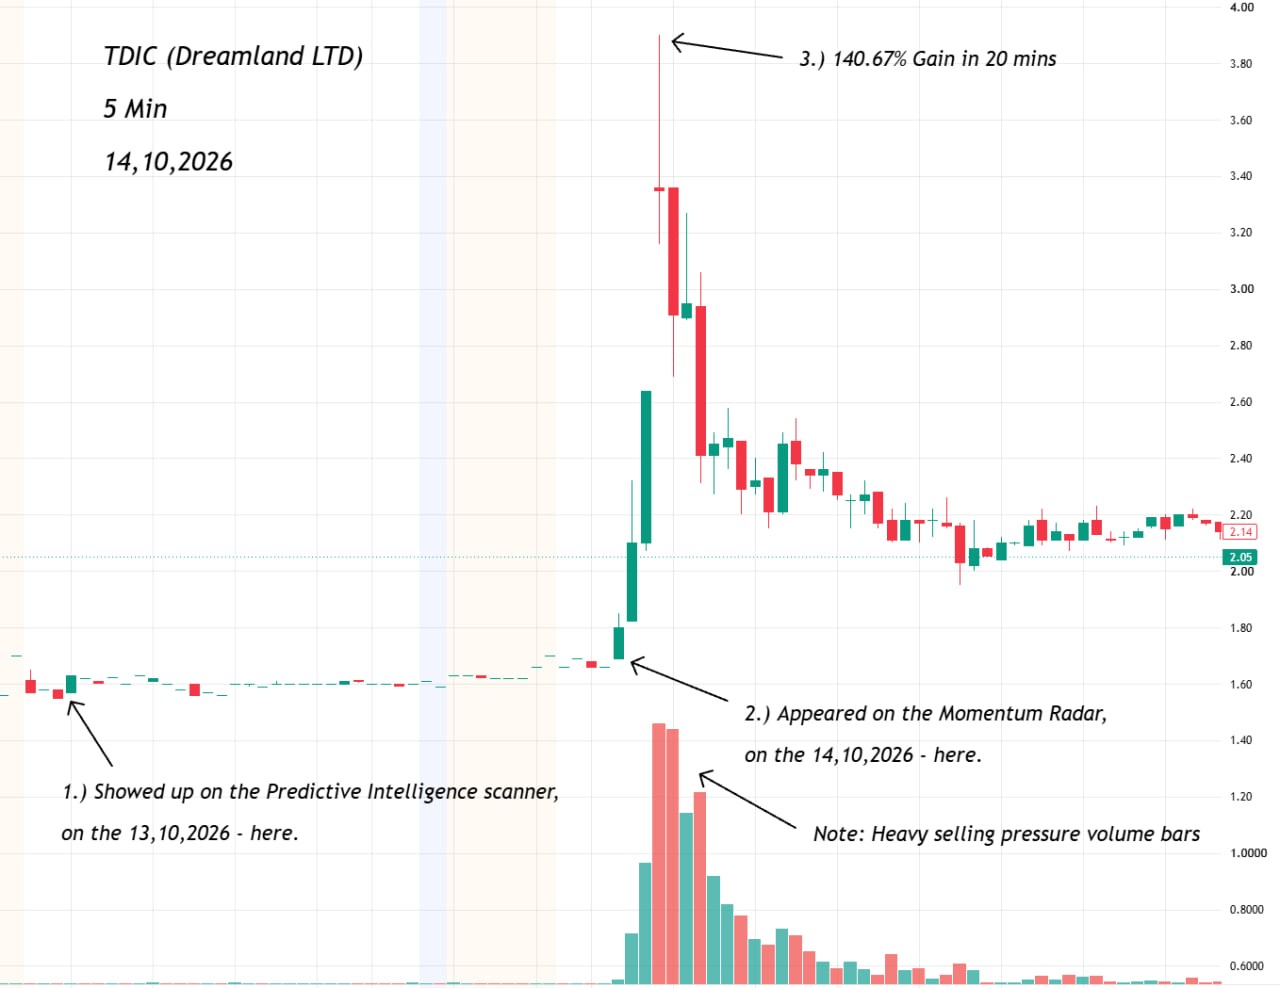 Click to enlarge
5-minute chart via TradingView. Annotations are mine.
- 13 Oct, 06:52 ET. A 6-K from Dreamland Ltd lands on the Predictive Intelligence ladder with an AI score of 35. The AI reads it as bearish: a private placement of 300,000 new Class A shares and 300,000 warrants, which is dilutive.
- 14 Oct. A Form 4 filing shows the CEO bought 1.5 million shares, taking his direct holdings to 2.57 million. The news prints, from a different source than my panel.
- TDIC shows up on the Momentum Radar and the chart runs +140.67% in 20 minutes.
- Heavy selling pressure volume bars follow, and the spike fades back to about $2.14.

Predictive Intelligence: TDIC on the ladder, dated 13 Oct, event 6-K, tagged bearish. This was captured later, so the price, volume and gain % here don’t match the Radar screenshot.
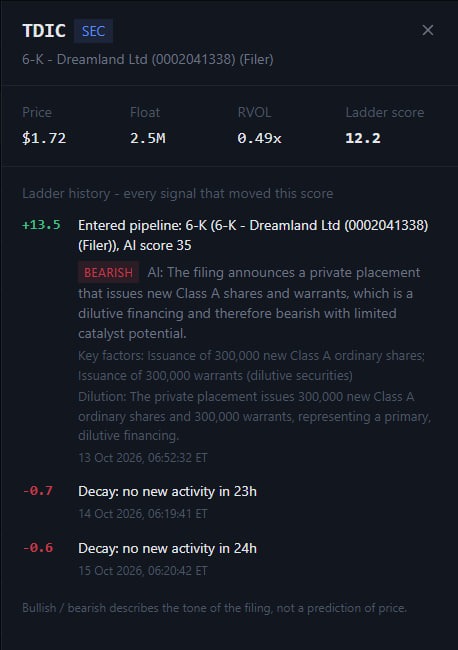
The ladder history for TDIC: in on 13 Oct, tagged bearish because the 6-K is a dilutive private placement, then decaying with no new activity. Nothing on the ladder shows the Form 4.

The news from 14 Oct. These lines came from a different source (see the note below), not from my panel.
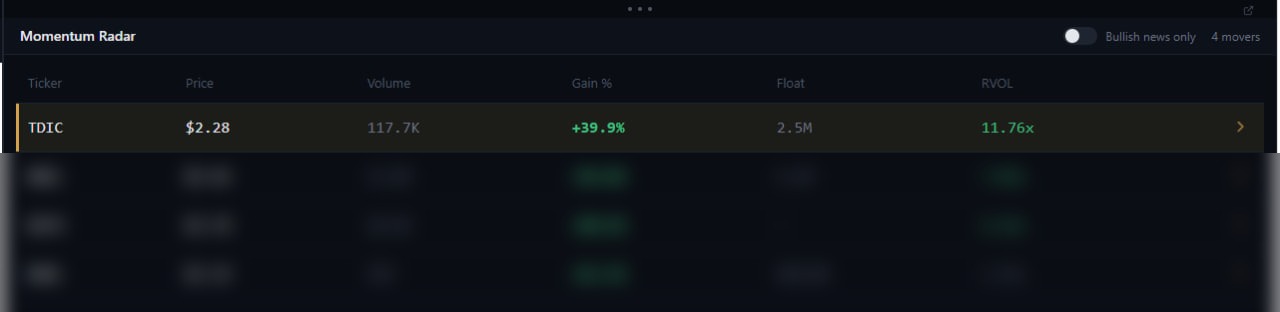
Momentum Radar, 14 Oct: TDIC among the movers. The other tickers are blurred.
Like the others on this page, this one was caught while I was still building the software, before it went live on real-time data. The news feed is still under development, so the news lines above came from a different source, and the screenshots were captured at different moments. The price, gain %, volume and RVOL on them are not exact and do not match from one screenshot to the next. That is why the Radar shows +39.9% while the chart shows the full +140.67% move. This case study also shows a real gap: the Form 4 that most likely drove the move was not picked up by Predictive Intelligence, and its score did not update. I am actively working on fixing that. It is part of the testing phase, and it is the reason this page exists. Once the software is live on real-time data, the case studies on this page will show the real figures.
What this shows: both scanners had it. Predictive Intelligence flagged TDIC on 13 Oct, a day before it moved, and the Momentum Radar picked it up on 14 Oct as it ran: a 2.5M float, an RVOL of 11.76x, and +140.67% in 20 minutes on the 5-minute chart. That is a very quick burst, which is the kind of move I look for as a scalp. What most likely drove it was a Form 4: the CEO bought 1.5 million shares, taking his direct holdings to 2.57 million. Insider buying is exactly the kind of event Predictive Intelligence is built to track. But this time it missed the update. The ladder only had the 6-K from 13 Oct, which the AI read as bearish and dilutive, a private placement of new shares and warrants, and the Form 4 never moved the score. So the ladder said one thing and the news said another. That is the reason I don’t read either scanner on its own, and the reason I still check the news myself. It is also the reason this page is open about it: it is a minor glitch, it is being fixed, and TDIC still made it onto both scanners. One more thing to be straight about: the spike did not hold. Heavy selling pressure volume bars followed and it faded back to about $2.14. This was a scalp, not something to hold. It worked for a scalp. This is a record of what the scanners showed, not a signal or a promise.
SPRC
SciSparc Ltd
7–15 Oct 2026
WORKED FOR SCALPING
CHOPPY: PRE-MARKET WAS THE CLEAN MOVE
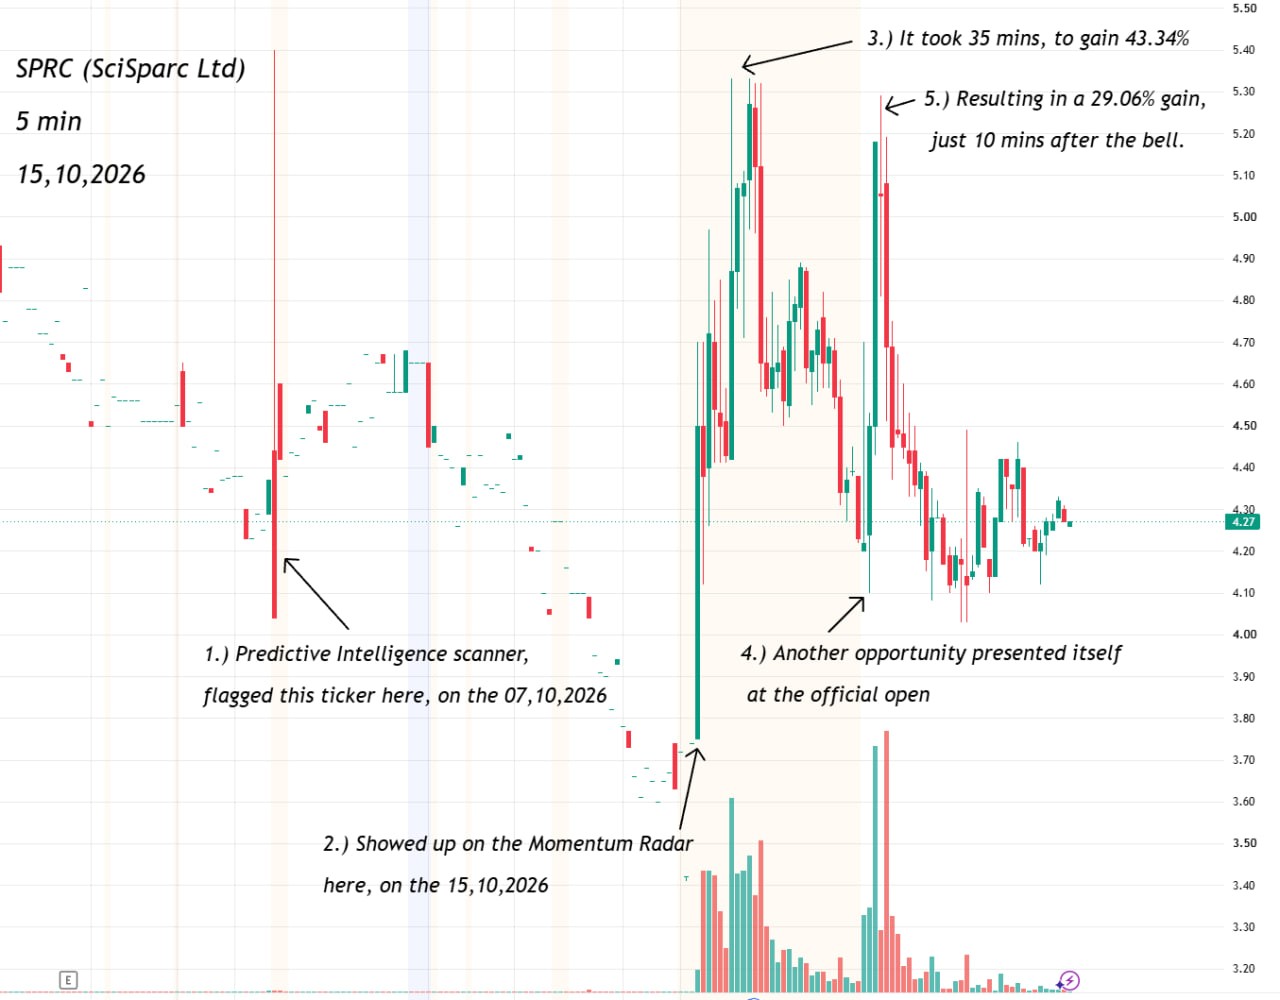 Click to enlarge
5-minute chart via TradingView. Annotations are mine.
- 7 Oct, 08:57 ET. A 6-K from SciSparc Ltd lands on the Predictive Intelligence ladder with an AI score of 35, tagged bullish. It forwards a press release about a technical achievement, with no commercial terms disclosed.
- 8–14 Oct. Nothing new follows, and the ladder score decays a little every day.
- 15 Oct, pre-market. News prints from a different source than my panel: SciSparc is shifting its strategic focus toward agentic-AI technologies, including cybersecurity and finance. SPRC shows up on the Momentum Radar and the chart runs +43.34% in 35 minutes. This was the clean move.
- It pulls back and chops around.
- At the official open, another opportunity: a +29.06% gain in the 10 minutes after the bell.
- The second spike fades, and the chart ends at about $4.27.

Predictive Intelligence: SPRC on the ladder, dated 07 Oct, event 6-K, tagged bullish. This was captured later, so the price, volume and gain % here don’t match the Radar screenshot.
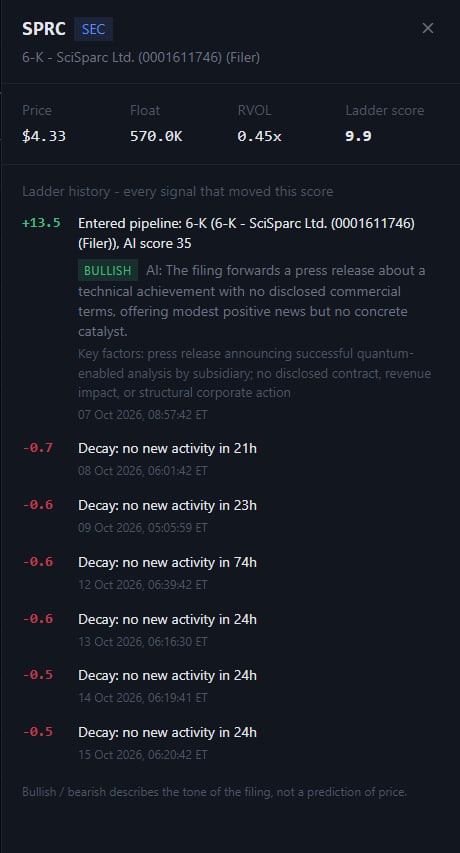
The ladder history for SPRC: in on 7 Oct with an AI score of 35, then decaying day after day with no new activity. The AI’s own verdict on the filing: “modest positive news but no concrete catalyst.”

The news, timed 07:10 and 07:56. These lines came from a different source (see the note below), not from my panel.
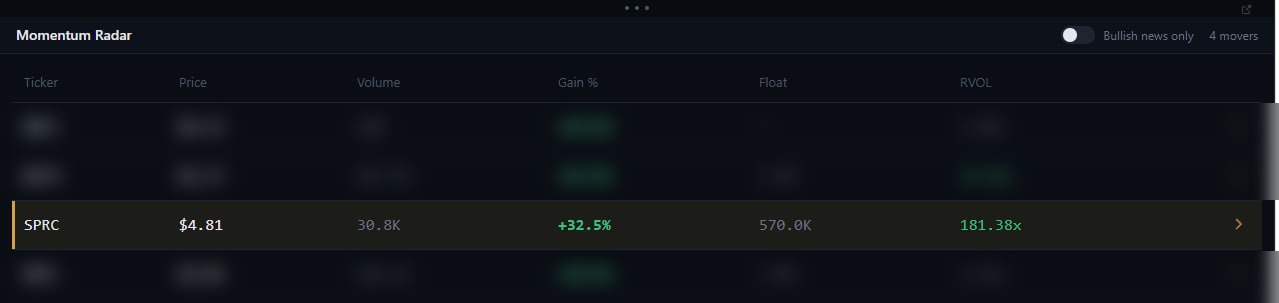
Momentum Radar, 15 Oct: SPRC among the movers. The other tickers are blurred. Look at the float and the RVOL.
Like the others on this page, this one was caught while I was still building the software, before it went live on real-time data. The news feed is still under development, so the news lines above came from a different source, and the screenshots were captured at different moments. The price, gain %, volume and RVOL on them are not exact and do not match from one screenshot to the next. That is why the Radar shows +32.5% at $4.81, the Predictive row shows $4.33, and the chart shows the full +43.34% move. What they show is that SPRC was on both scanners, which is the point of this case study. Once the software is live on real-time data, the case studies on this page will show the real figures.
What this shows: both scanners had it, and this one is a good example of why Predictive Intelligence is worth having. It put SPRC on the ladder on 7 Oct, eight days before it moved. By 15 Oct the score had decayed to 9.9, and the filing itself, a press release about a technical achievement with no commercial terms, was never the catalyst. The AI’s own verdict was “modest positive news but no concrete catalyst.” What the ladder did was put the name in front of me early. So when SPRC lit up on the Momentum Radar on 15 Oct, with a float of just 570K and an RVOL of 181.38x, I already knew the ticker. The news, from a different source, most likely drove the move: a shift in strategic focus toward agentic-AI technologies. The pre-market run was the clean one: +43.34% in 35 minutes. After that the chart pulled back and got choppy. There was a second chance at the official open, a +29.06% gain in the 10 minutes after the bell, but that one was harder to trade, and I would have been content with the pre-market move and left it there. It faded back to about $4.27, so this was a scalp, not something to hold. It worked for a scalp. This is a record of what the scanners showed, not a signal or a promise.
CLRO
ClearOne Inc
5–23 Oct 2026
WORKED FOR SCALPING
NO NEWS: A WILD CARD PLAY
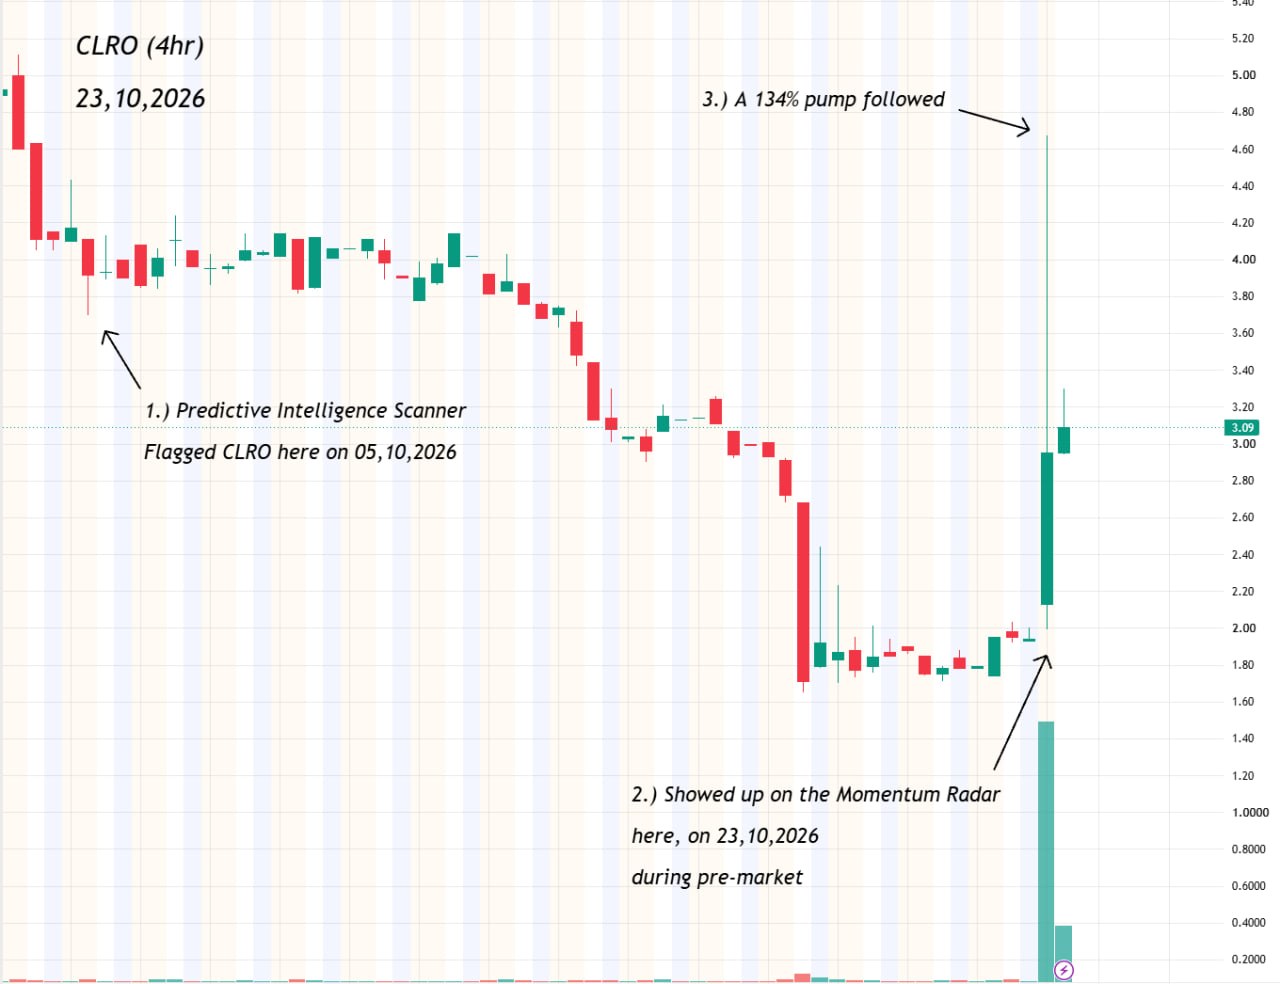 Click to enlarge
4-hour chart via TradingView. Annotations are mine.
- 5 Oct, 09:19 ET. An S-1 from ClearOne lands on the Predictive Intelligence ladder with an AI score of 45. The AI reads it as bearish: a primary offering of up to 4,285,714 units (a share plus a warrant) that needs Nasdaq stockholder approval, which dilutes existing shareholders. The ladder also logs a Reg SHO threshold list hit, dated 2 Oct.
- 6–22 Oct. Nothing new follows, and the ladder score decays a little every day. On the chart the stock drifts lower, from around $4 to under $2.
- 23 Oct, pre-market. With no news that I could see, CLRO shows up on the Momentum Radar, a 2.7M float stock, and the chart runs about +134% to the high.
- The spike fades, and the chart ends at about $3.09.

Predictive Intelligence: CLRO on the ladder, dated 05 Oct, event S-1, tagged bearish. This was captured later, so the price, volume and gain % here don’t match the Radar screenshot.
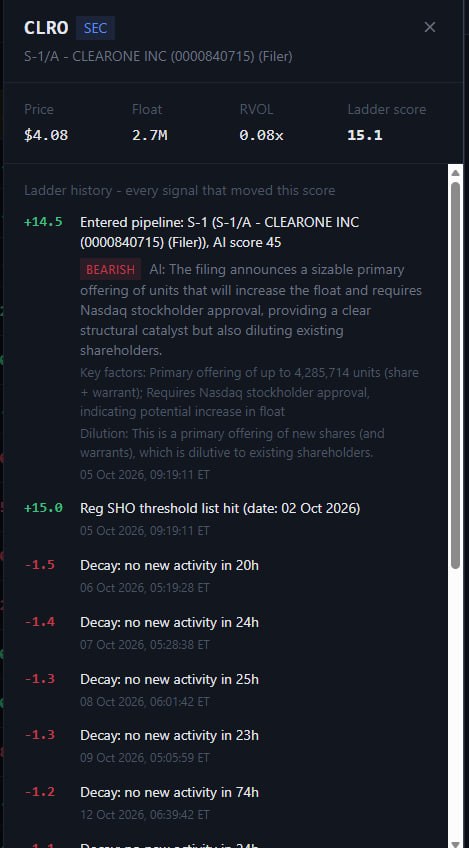
The ladder history for CLRO: in on 5 Oct, tagged bearish because the filing is a dilutive offering, a Reg SHO threshold list hit on top, then decaying with no new activity.
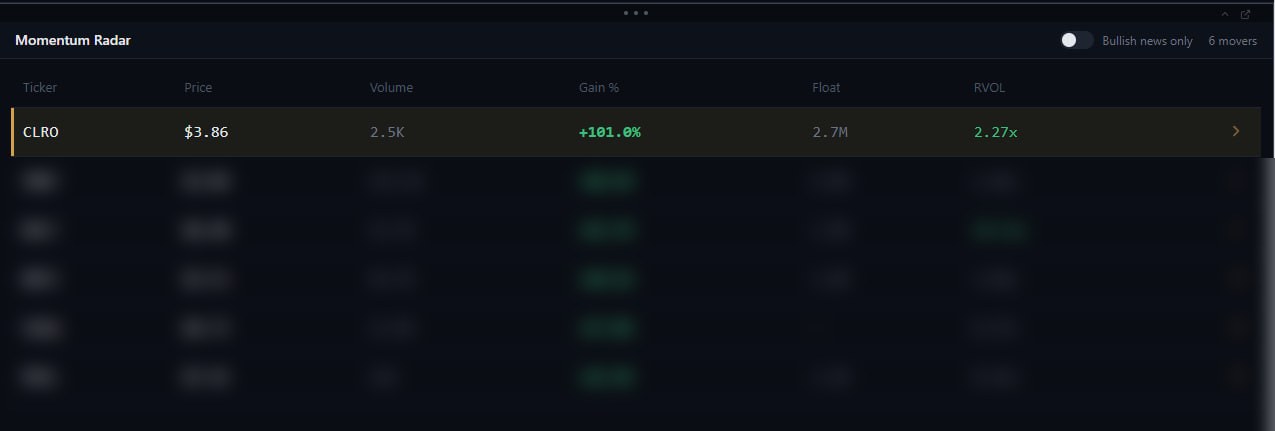
Momentum Radar, 23 Oct: CLRO among the movers. The other tickers are blurred.
Like the others on this page, this one was caught while I was still building the software, before it went live on real-time data. The screenshots were captured at different moments, so the price, gain %, volume and RVOL on them are not exact and do not match from one screenshot to the next. That is why the Radar shows +101.0% at $3.86, the Predictive row shows $4.08 and −18.4%, and the chart shows about +134% to the high of the spike. Part of that high was a thin spike, so the part a scalper could realistically trade was smaller. What they show is that CLRO was on both scanners, which is the point of this case study. Once the software is live on real-time data, the case studies on this page will show the real figures.
What this shows: both scanners had it, but this one was more of a wild card play than the others. Predictive Intelligence put CLRO on the ladder on 5 Oct, eighteen days before it moved, and it tagged it bearish for a good reason: the filing was a primary offering of new shares and warrants, which is dilutive. The ladder also logged a Reg SHO threshold list hit. When CLRO lit up on the Momentum Radar on 23 Oct in pre-market, I already knew the ticker. And there was no news behind the move that I could see. A bearish tag did not stop it getting attention, and the chart ran about +134% to the high before fading back to about $3.09. A move like that with no news is one I treat carefully. When a company has an offering in the works, a stock can get pushed higher before the deal is priced, or before holders want to sell. I can’t tell from the chart whether that is what happened here, and I am not claiming it was. But it is the reason I would not read the bearish tag as “ignore this name”, and equally not as a reason to hold it. It was a scalp at best. The scanners did their job: they matched the ticker on both, early. What to do with it was still my call. This is a record of what the scanners showed, not a signal or a promise.
EPOW
E-Power Inc
7–26 Oct 2026
BROKE THE 20% THRESHOLD
CHOPPY, LOW VOLUME: NOT ONE I WOULD HAVE TRADED
 Click to enlarge
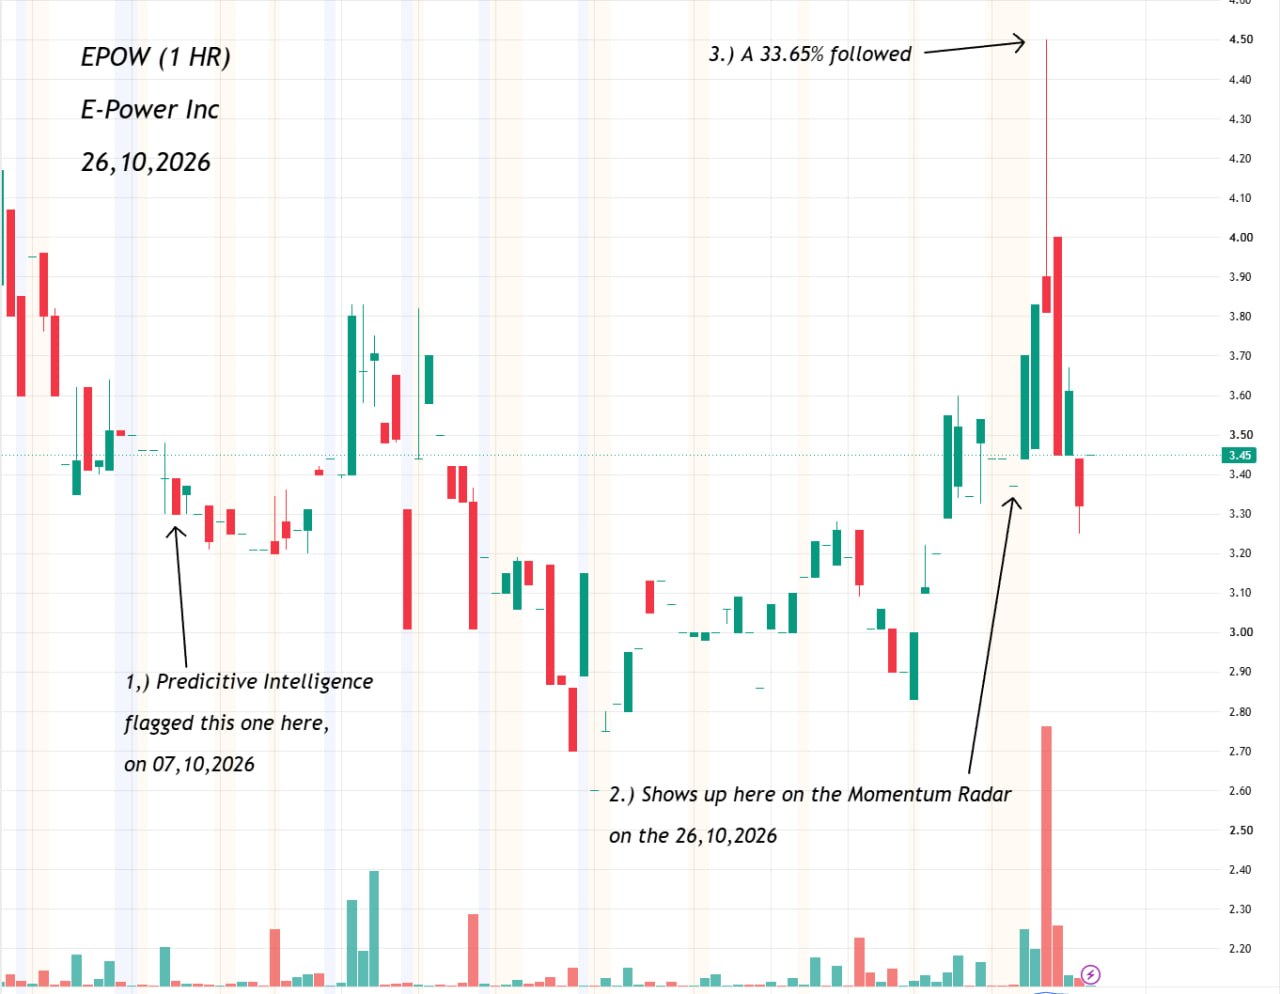
1-hour chart via TradingView. Annotations are mine.
- 7 Oct, 05:37 ET. A 6-K from E-Power Inc lands on the Predictive Intelligence ladder with an AI score of 38, tagged bearish. It reports a registered direct offering of 229,097 new Class A shares and pre-funded warrants, plus placement agent warrants, which the AI reads as dilutive financing.
- 8 Oct onwards. Nothing new follows, and the ladder score decays a little every day.
- 26 Oct, 11:02 ET. Mid-morning, in regular hours, news prints from a different source than my panel: a subsidiary, Sunrise New Energy Materials, receives a capital raise of about $16.5M. EPOW shows up on the Momentum Radar and the chart runs +33.65% to the high. It is choppy and on low volume.
- The spike fades, and the chart ends at about $3.45.

The news, timed 11:02 ET, mid-morning in regular hours. This line came from a different source (see the note below), not from my panel.
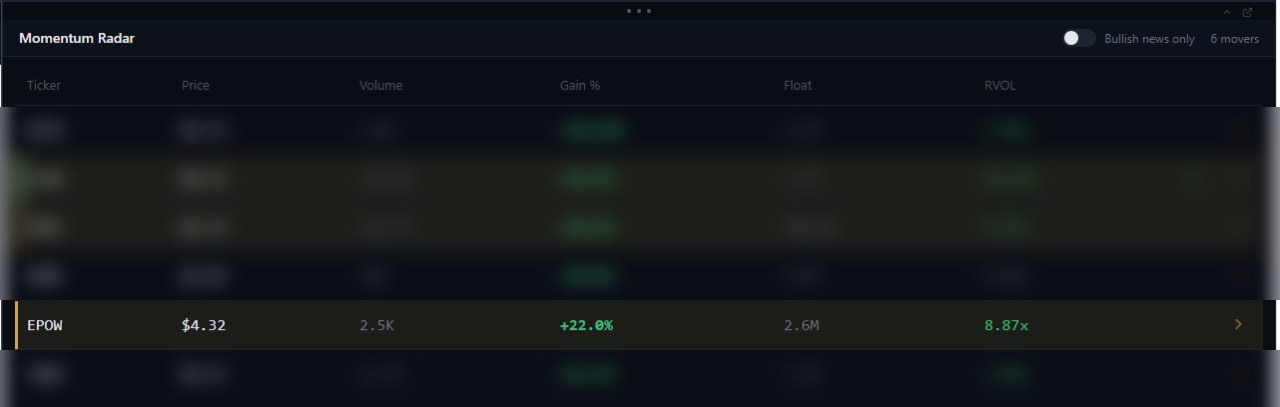
Momentum Radar, 26 Oct: EPOW among the movers. The other tickers are blurred.
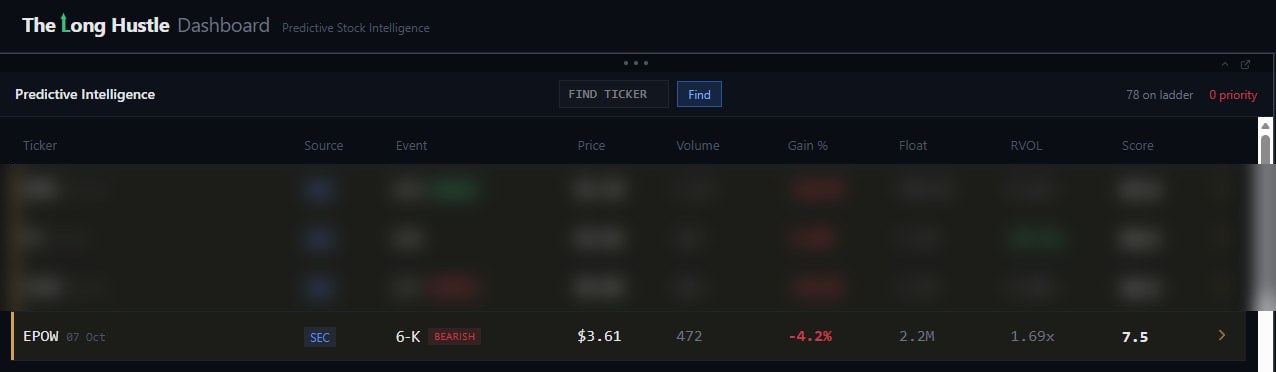
Predictive Intelligence: EPOW on the ladder, dated 07 Oct, event 6-K, tagged bearish. The other tickers are blurred. The price, volume and gain % here are from a different moment than the Radar screenshot, so they don’t match.
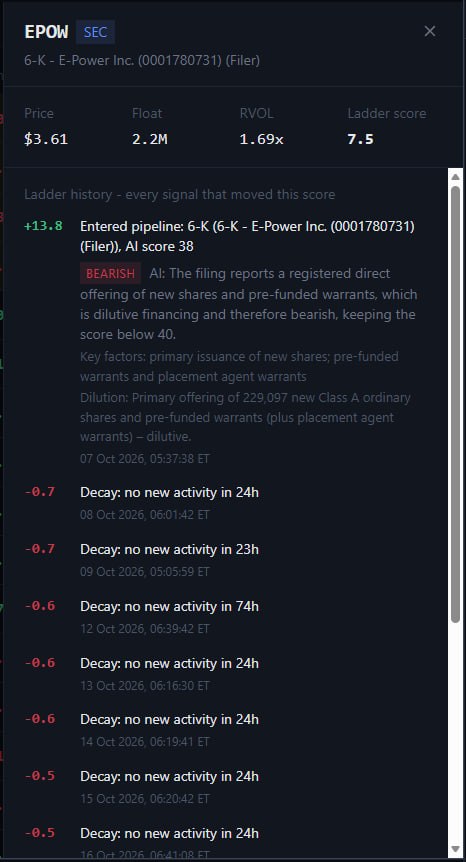
The ladder history for EPOW: in on 7 Oct, tagged bearish because the filing is a dilutive offering, then decaying day after day with no new activity.
Like the others on this page, this one was caught while I was still building the software, before it went live on real-time data. The news feed is still under development, so the news line above came from a different source, and the screenshots were captured at different moments. The price, gain %, volume, float and RVOL on them are not exact and do not match from one screenshot to the next. That is why the Radar shows +22.0% at $4.32, the Predictive row shows $3.61 and −4.2%, and the chart shows the full +33.65% move to the high. What they show is that EPOW was on both scanners, which is the point of this case study. Once the software is live on real-time data, the case studies on this page will show the real figures.
What this shows: both scanners had it, and this is the plainest example on the page of the scanners doing their job without it being a trade I would have taken. Predictive Intelligence put EPOW on the ladder on 7 Oct, nineteen days before it moved, and tagged it bearish for a good reason: the filing was a registered direct offering of new shares and warrants, which is dilutive. The score decayed to 7.5 by 26 Oct. So when EPOW showed up on the Momentum Radar that day, with a 2.6M float and an RVOL of 8.87x, I already knew the ticker. The news, from a different source, most likely drove it: a capital raise of about $16.5M at a subsidiary. The chart broke above the Radar’s 20% threshold and reached a high of +33.65%, which is why it earns its place in the “what worked” column. But it was choppy, it was on low volume, and it was not a setup I would have traded myself. The move was there. The quality was not. That is the point of this case study: it shows what the scanners flagged and when, not what I would trade. This is a record of what the scanners showed, not a signal or a promise.
MSGY
Masonglory Ltd
6–26 Oct 2026
WORKED FOR SCALPING AT THE OPEN
NO NEWS: NOT A PRE-MARKET MOVE
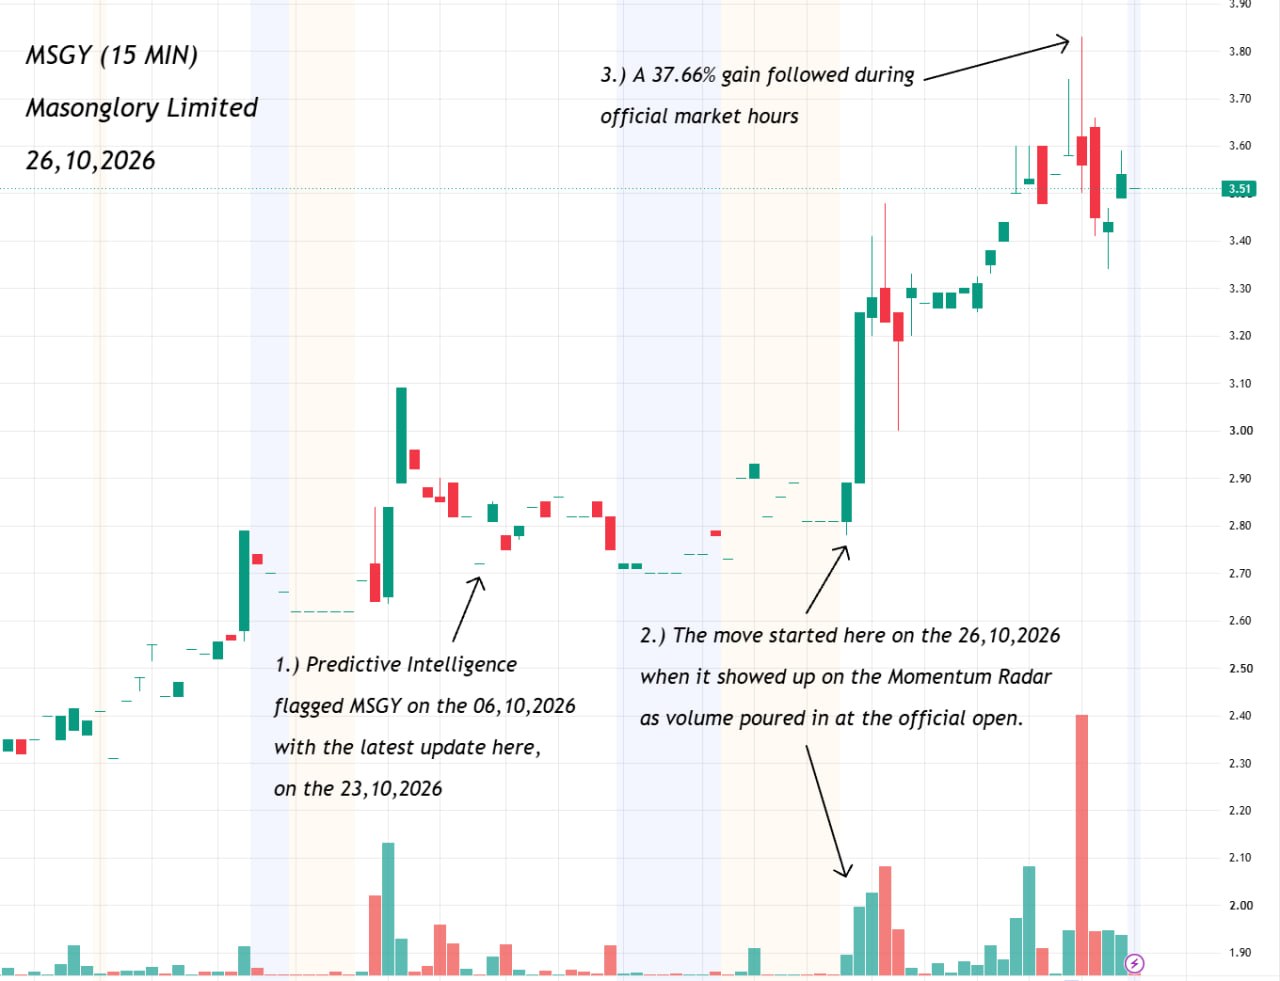 Click to enlarge
15-minute chart via TradingView. Annotations are mine.
- 6 Oct, 09:22 ET. A 6-K from Masonglory Ltd lands on the Predictive Intelligence ladder with an AI score of 65, tagged bearish. It announces a private placement of 667,000 new Class A ordinary shares plus Series A and Series B warrants. The AI calls it a clear structural change that can act as a catalyst, but also dilutive. The ladder also logs a Reg SHO threshold list hit, dated 5 Oct.
- 7–23 Oct. The ladder score decays a little every day, and the ticker gets a further update on 23 Oct.
- 26 Oct, the official open. With no news, volume pours in at the open. MSGY shows up on the Momentum Radar and the chart starts to run.
- It keeps climbing through official market hours to a gain of +37.66%, and the chart ends at about $3.51.
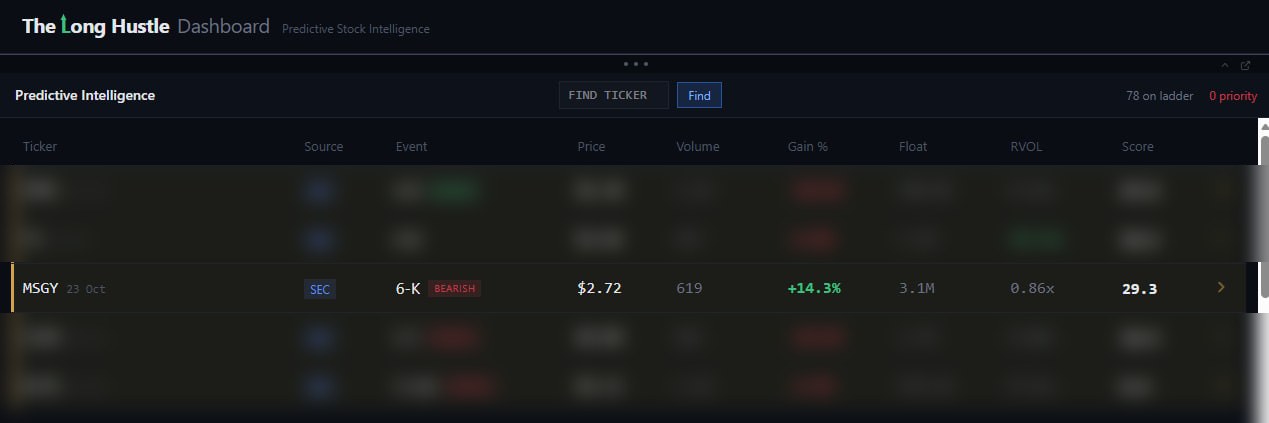
Predictive Intelligence: MSGY on the ladder, dated 23 Oct (its latest update), event 6-K, tagged bearish. The other tickers are blurred. This was captured later, so the price, volume and gain % here don’t match the Radar screenshot.
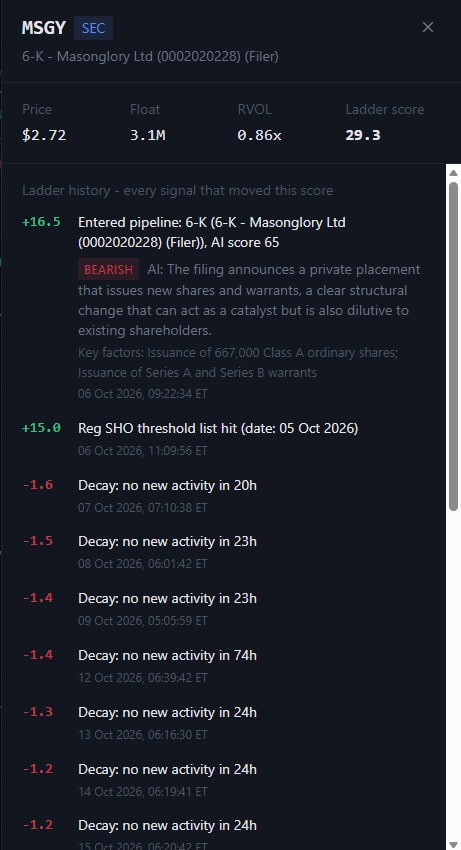
The ladder history for MSGY: in on 6 Oct with an AI score of 65, tagged bearish because the filing is a dilutive private placement, a Reg SHO threshold list hit on top, then decaying.
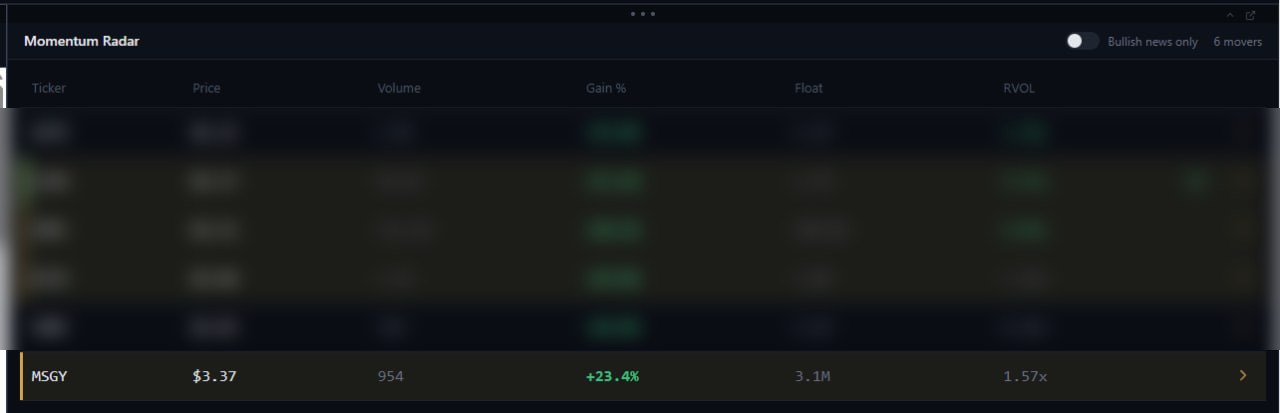
Momentum Radar, 26 Oct: MSGY among the movers. The other tickers are blurred.
Like the others on this page, this one was caught while I was still building the software, before it went live on real-time data. So the screenshots were captured at different moments, and the price, gain %, volume and RVOL on them don’t match from one to the next. The Radar shows +23.4% at $3.37 part-way through the move, the Predictive row was captured at a different moment and shows +14.3% at $2.72, and the chart shows the full +37.66%. What they show is that MSGY was on both scanners, and when.
What this shows: both scanners had it. Predictive Intelligence put MSGY on the ladder on 6 Oct, twenty days before it moved, and tagged it bearish because the filing was a dilutive private placement. The ladder also logged a Reg SHO threshold list hit, and the ticker got a further update on 23 Oct. There was no news on 26 Oct. What happened instead was volume pouring in at the official open: MSGY lit up on the Momentum Radar and ran +37.66% during official market hours. I mainly trade pre-market, but I do run into the open for at least the first 30 minutes to an hour, and this one started right there. That is a scalp that could have been taken at the open, which is why it earns its place in the “what worked” column. It met the criteria: both scanners, a clean pump at the open, and well past the 20% mark. It was not a pre-market move, and it had no news behind it, so I list both of those up front. This is a record of what the scanners showed, not a signal or a promise.
GCTK
GlucoTrack, Inc.
14–26 Oct 2026
WORKED FOR SCALPING
BEARISH FILING: NO NEWS ON THE DAY
 Click to enlarge
1-hour chart via TradingView. Annotations are mine.
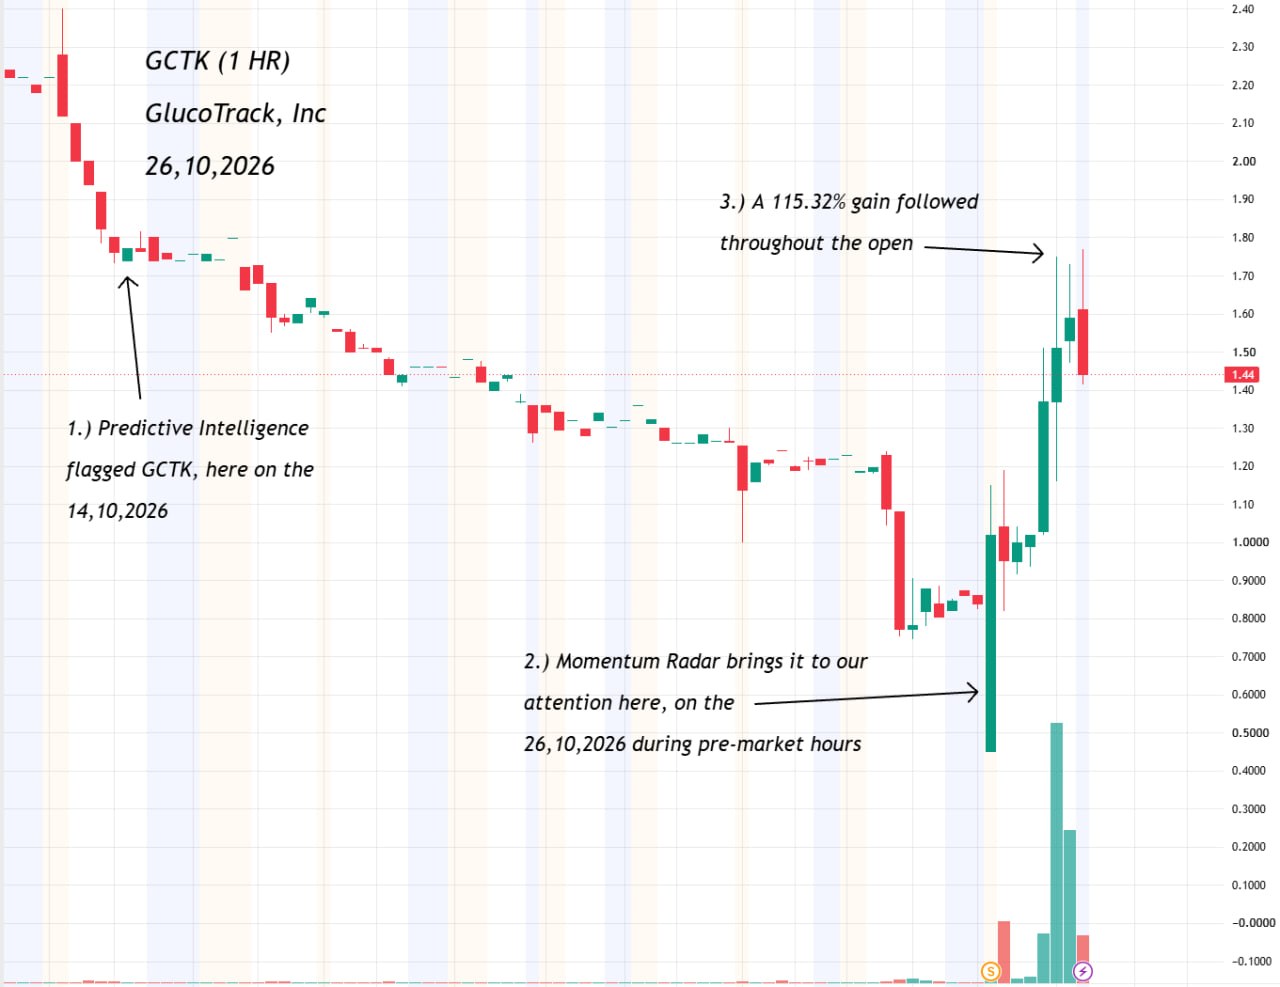
- 14 Oct, 06:33 ET. An S-1/A from GlucoTrack lands on the Predictive Intelligence ladder with an AI score of 35, tagged bearish. It registers a primary offering of over 43 million shares plus warrant programs, which is dilutive, and the AI also notes a Nasdaq notice for failing the $1.00 minimum bid price.
- 15–23 Oct. Nothing new follows, and the ladder score decays a little every day. On the chart the stock slides to under $1.
- 26 Oct, end of pre-market. There is no news that day. The most recent news was a 1-for-2 reverse stock split. GCTK shows up on the Momentum Radar and the chart starts to run.
- It carries on into the official open on very heavy volume, to a gain of +115.32%, and the chart ends at about $1.44.
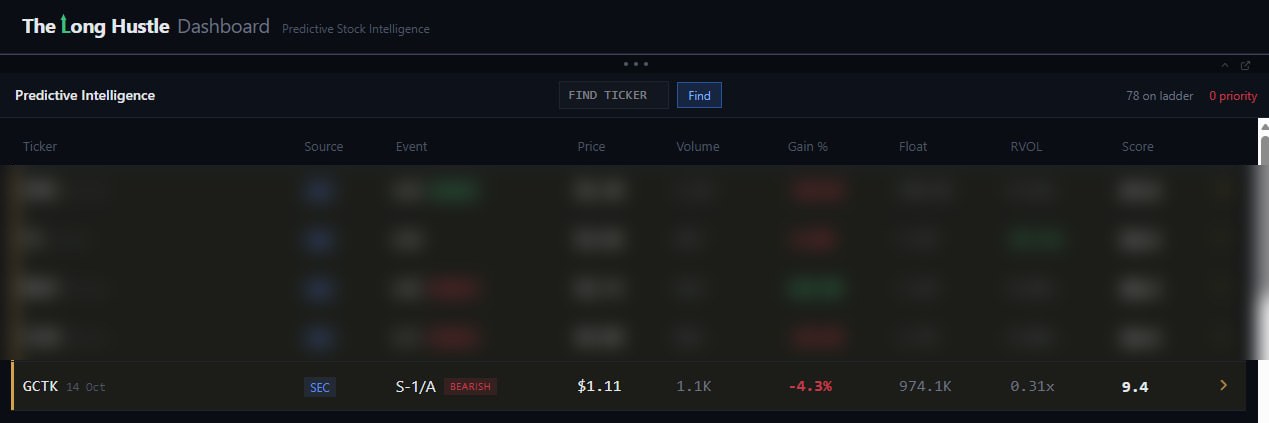
Predictive Intelligence: GCTK on the ladder, dated 14 Oct, event S-1/A, tagged bearish. The other tickers are blurred. This was captured at a different moment, so the price, volume and gain % here don’t match the Radar screenshot.
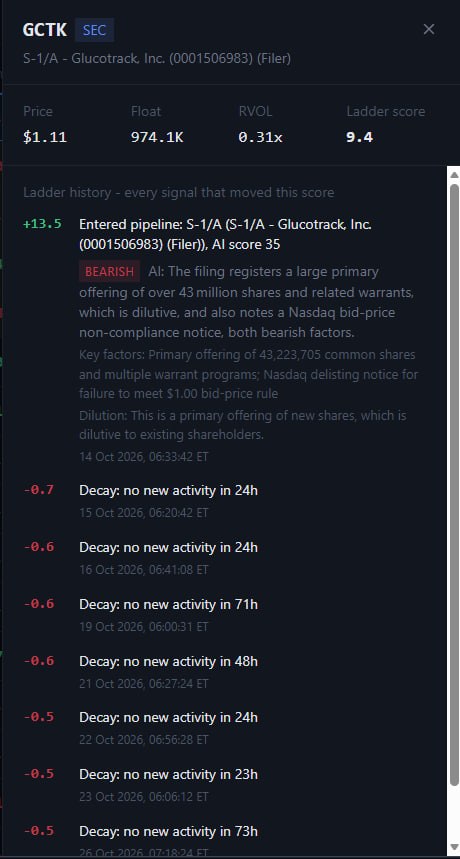
The ladder history for GCTK: in on 14 Oct, tagged bearish because the filing is a dilutive offering with a Nasdaq bid-price notice, then decaying day after day with no new activity.
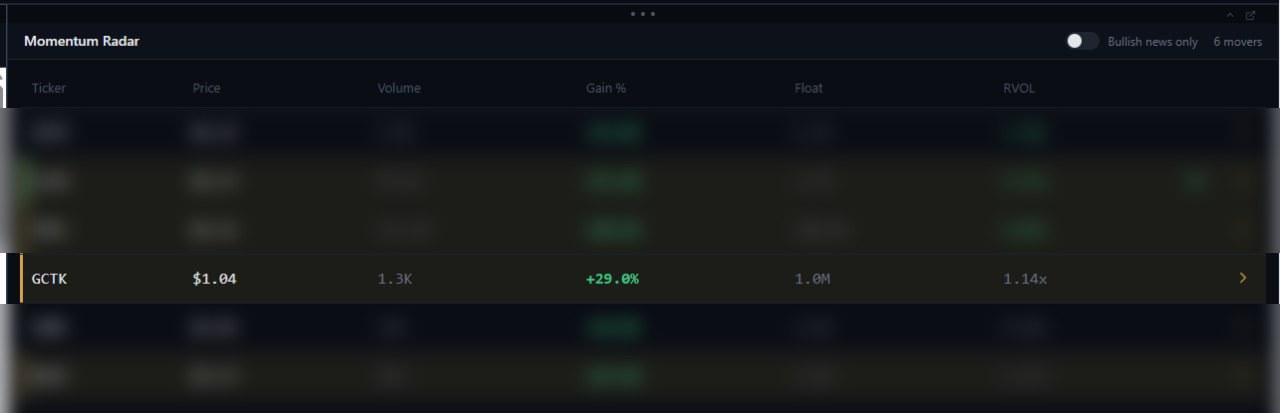
Momentum Radar, 26 Oct: GCTK among the movers. The other tickers are blurred.
Like the others on this page, this one was caught while I was still building the software, before it went live on real-time data. So the screenshots were captured at different moments, and the price, gain %, volume and RVOL on them don’t match from one to the next. The Radar shows +29.0% at $1.04 early in the move, the Predictive row was captured at a different moment and shows −4.3% at $1.11, and the chart shows the full +115.32%. What they show is that GCTK was on both scanners, and when.
What this shows: both scanners had it, and this one gave a scalper plenty of chances. Predictive Intelligence put GCTK on the ladder on 14 Oct, twelve days before it moved, and tagged it bearish for a good reason: the filing was a large, dilutive primary offering, and the AI also picked up a Nasdaq bid-price notice. The score had decayed to 9.4 by the 26th. Then, at the end of pre-market on 26 Oct, the Momentum Radar flagged it: a float under 1M that had started to run, with no news that day. The most recent news was a 1-for-2 reverse stock split, nothing on the day itself. It carried on into the official open on very heavy volume and went on to a gain of +115.32%. That is a tiny float, very heavy volume, and a move that started late in pre-market and kept going through the open, which is the kind of setup I look for. The ladder said bearish and the Radar said run, which is why I don’t read either scanner on its own. This is a record of what the scanners showed, not a signal or a promise.
TNMG
TNL Mediagene
5–30 Oct 2026
WORKED FOR SCALPING
NEWS ON THE DAY: VERY HIGH RVOL
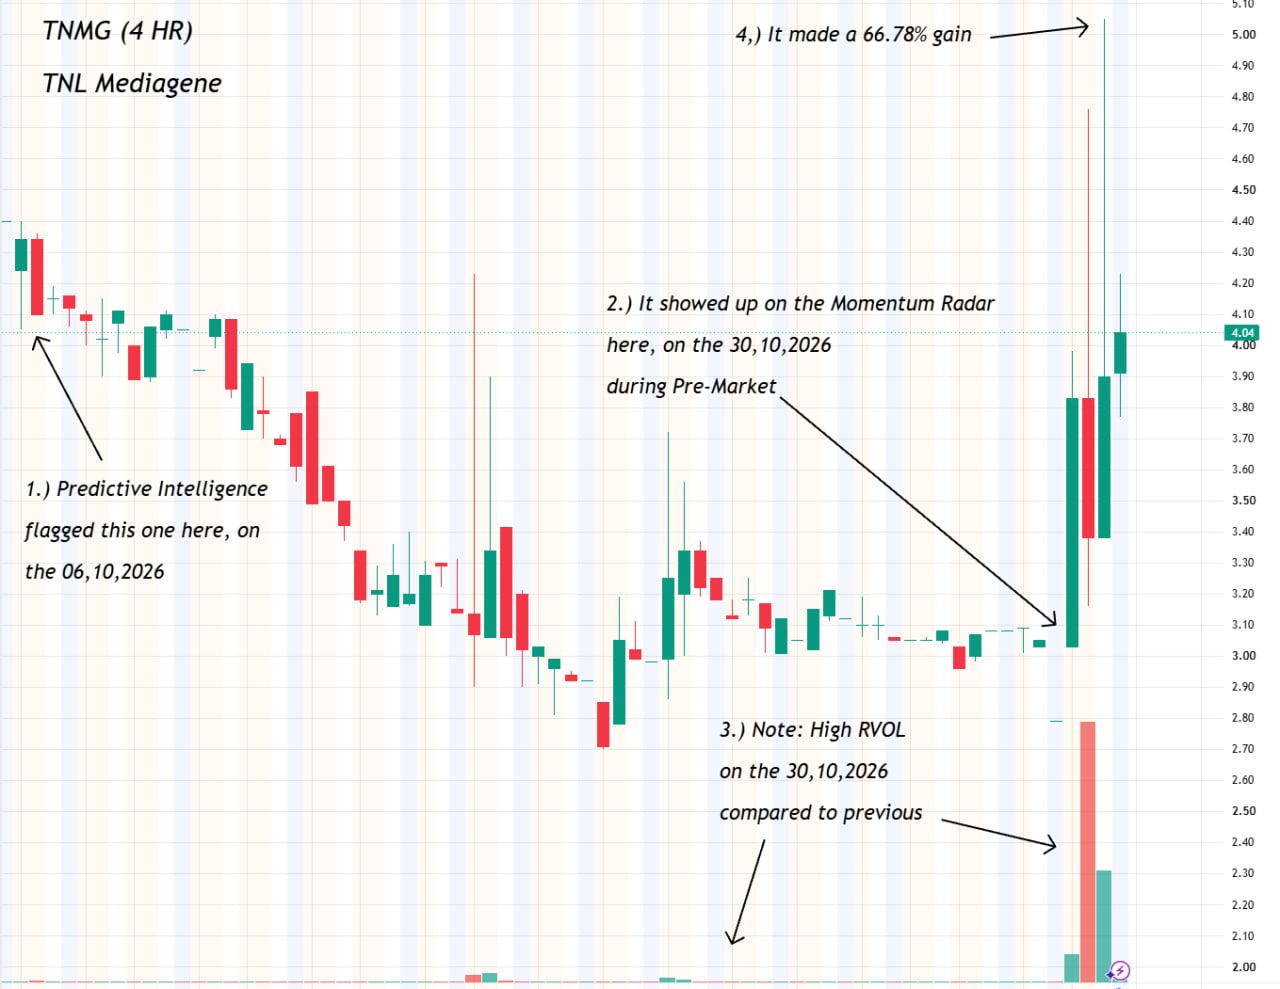 Click to enlarge
4-hour chart via TradingView. Annotations are mine.
- 5 Oct, 15:50 ET. A 6-K from TNL Mediagene lands on the Predictive Intelligence ladder with an AI score of 55. It announces a definitive agreement to sell the company’s Japanese subsidiary, valued at $5.5 million, with closing expected by 30 Oct. The AI tags it bearish, calling it a material structural change whose near-term impact is unclear. The chart marks the first session after it, 6 Oct.
- 6–19 Oct and beyond. No new activity, so the ladder score decays a little every day. On the chart the stock drifts lower and settles around $3.
- 30 Oct, pre-market. There is news that day: TNL Mediagene sells its Japan unit for $5.5M and says it regains Nasdaq equity compliance, and a second headline says it has completed the sale of its Japanese business in a management buyout. TNMG shows up on the Momentum Radar. The ladder row is also dated 30 Oct and now shows a 6-K tagged bullish, the most recent update on the ticker.
- The move starts in pre-market and carries on into the official open, to a gain of +66.78%. The chart ends at about $4.04.

The news on TNMG: the sale of its Japan unit for $5.5M, the company regaining Nasdaq equity compliance, and the completed sale of its Japanese business in a management buyout.

Predictive Intelligence: TNMG on the ladder. The row is dated 30 Oct, the most recent update, a 6-K tagged bullish. It was captured before the move, so the price, volume and gain % here don’t match the Radar screenshot.
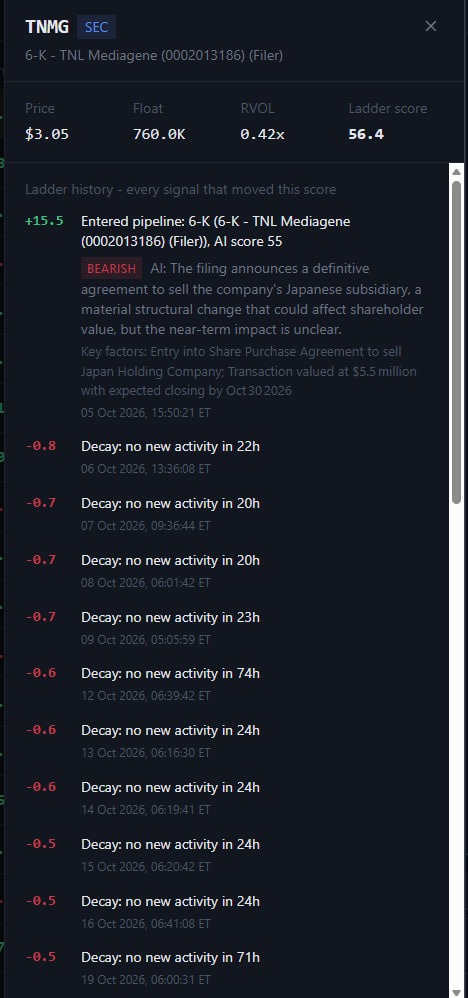
The ladder history for TNMG: in on 5 Oct with an AI score of 55, then decaying day after day with no new activity. The panel is cut off at 19 Oct, before the latest update.

Momentum Radar, 30 Oct: TNMG among the movers.
Like the others on this page, this one was caught while I was still building the software, before it went live on real-time data. So the screenshots were captured at different moments, and the price, gain %, volume and RVOL on them don’t match from one to the next. The Radar shows +35.7% at $4.14 on 262.1K shares, the Predictive row was captured before the move and shows +1.0% at $3.05 on 100 shares, and the chart shows the full +66.78%. What they show is that TNMG was on both scanners, and when.
What this shows: both scanners had it, and this one gave a scalper plenty of chances. Predictive Intelligence put TNMG on the ladder on 5 Oct, nearly four weeks before it moved, on a 6-K about the sale of its Japanese subsidiary. The AI called it bearish, and the stock slid for a while afterwards. The deal in that filing is what finally made the news on 30 Oct: the sale of the Japan unit completed, and the company said it regains Nasdaq equity compliance. That morning the Momentum Radar flagged it in pre-market: a float of just 760K, volume far above anything on the chart before it, and a news catalyst. The move started in pre-market and carried on into the official open, for a gain of +66.78%. A tiny float, very high relative volume, news and a move that runs from pre-market into the open is the kind of setup I look for. It was a nice scalp, and it earned its place in this column. This is a record of what the scanners showed, not a signal or a promise.
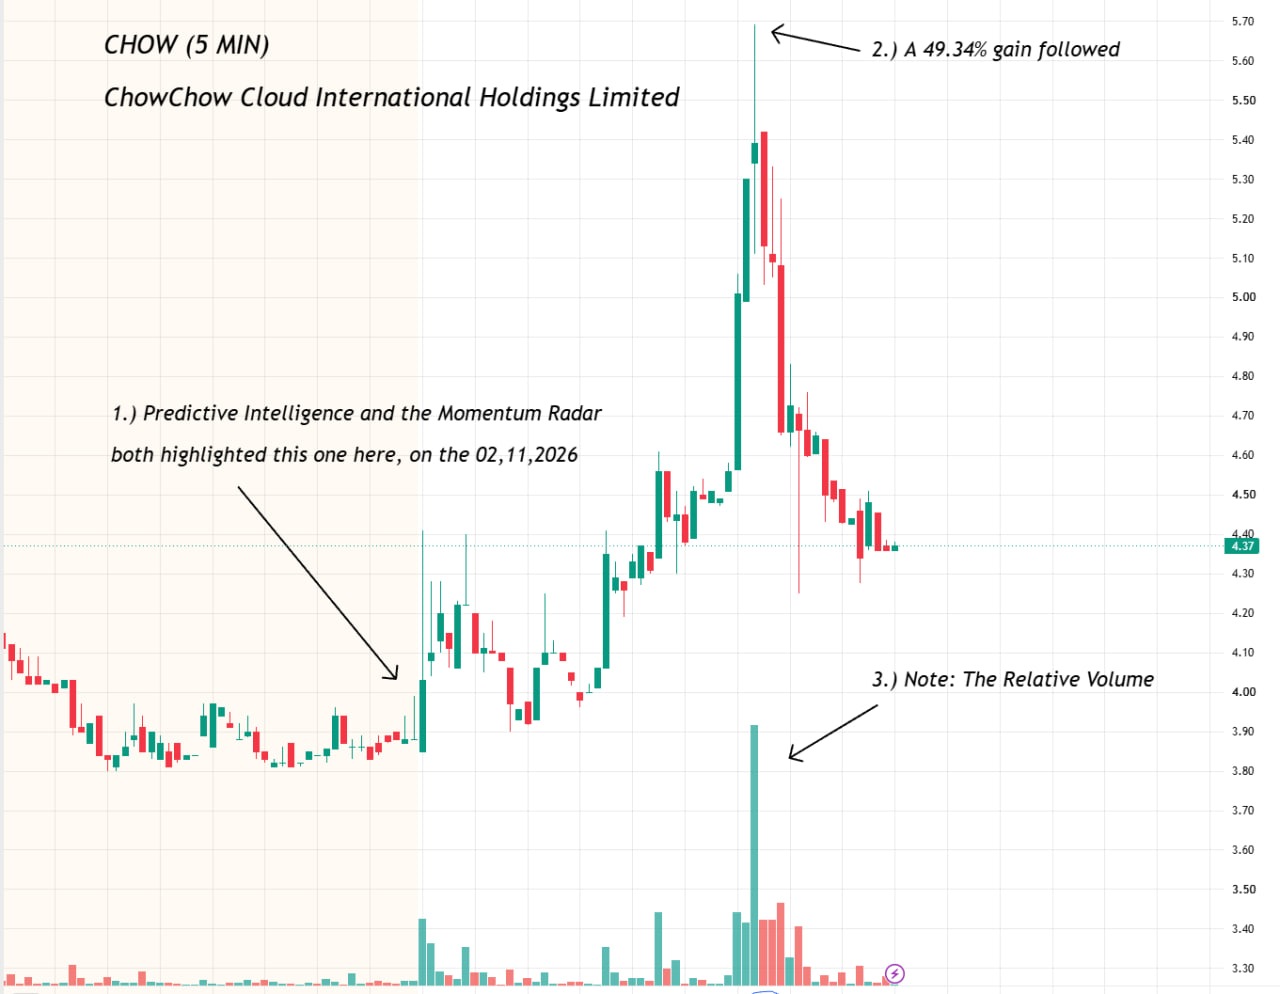
CHOW
ChowChow Cloud International
2 Nov 2026
WORKED FOR SCALPING
NO NEWS ON THE DAY: RELATIVE VOLUME DROVE IT
 Click to enlarge
5-minute chart via TradingView. Annotations are mine.
- 2 Nov, 05:31 ET. A 6-K from ChowChow Cloud International Holdings enters the Predictive Intelligence ladder with an AI score of 35. It reports a primary issuance of new restricted shares, closed after a 1-for-10 reverse split. The AI tags it bearish and dilutive, which keeps the score low. That tag describes the tone of the filing, not where the price goes next.
- 2 Nov, same day. The Momentum Radar also has CHOW among the day’s movers, so both scanners flagged it on the same date. There was no news catalyst.
- The official open. After a quiet pre-market, the stock starts to move right at the open, well inside the window I trade. Relative volume comes in and the stock runs, with plenty of scalping opportunities on the way up.
- The move peaks for a gain of +49.34%, then fades back. The chart ends at about $4.37.
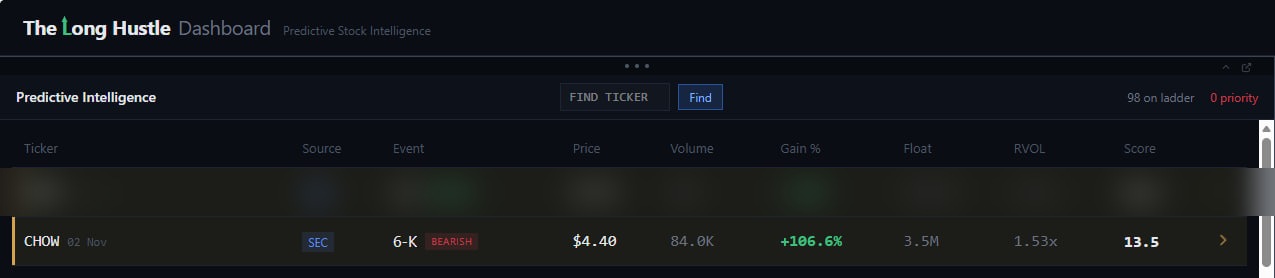
Predictive Intelligence: CHOW on the ladder, dated 2 Nov. The row above it is blurred; it is a different ticker.
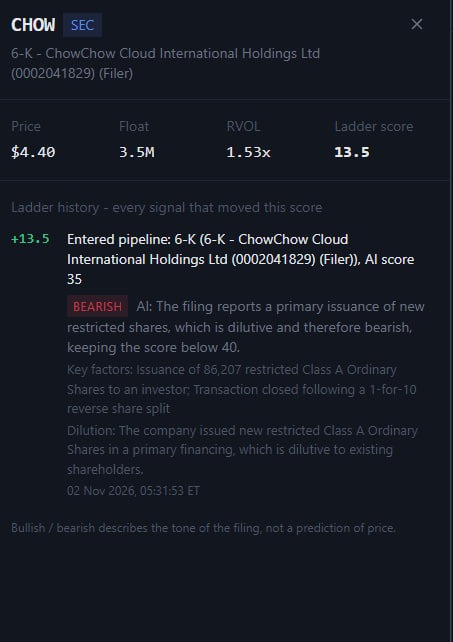
The ladder history for CHOW: in on 2 Nov, 05:31 ET, with an AI score of 35. Bullish or bearish describes the tone of the filing, not a prediction of price.

Momentum Radar, 2 Nov: CHOW among the movers. The other ticker is blurred.
Like the others on this page, this one was caught while I was still building the software, before it went live on real-time data. The screenshots were captured at different moments, so the figures on them don’t match the chart. The scanners show +106.6% at $4.40 on 84.0K shares at the moment of capture, while the +49.34% on the chart is the move I marked from the breakout to the high. What they show is that CHOW was on both scanners, and when.
What this shows: both scanners had it on the same day, and it fell inside my trading window. Predictive Intelligence picked up the 6-K in pre-market and the Momentum Radar flagged the stock. There was no news catalyst, and the filing was tagged bearish, so this wasn’t a story-driven move. What drove it was relative volume. The stock started moving right at the official open and rallied 49.34%, with plenty of scalping opportunities along the way. It met the criteria, and it earned its place in this column. This is a record of what the scanners showed, not a signal or a promise.
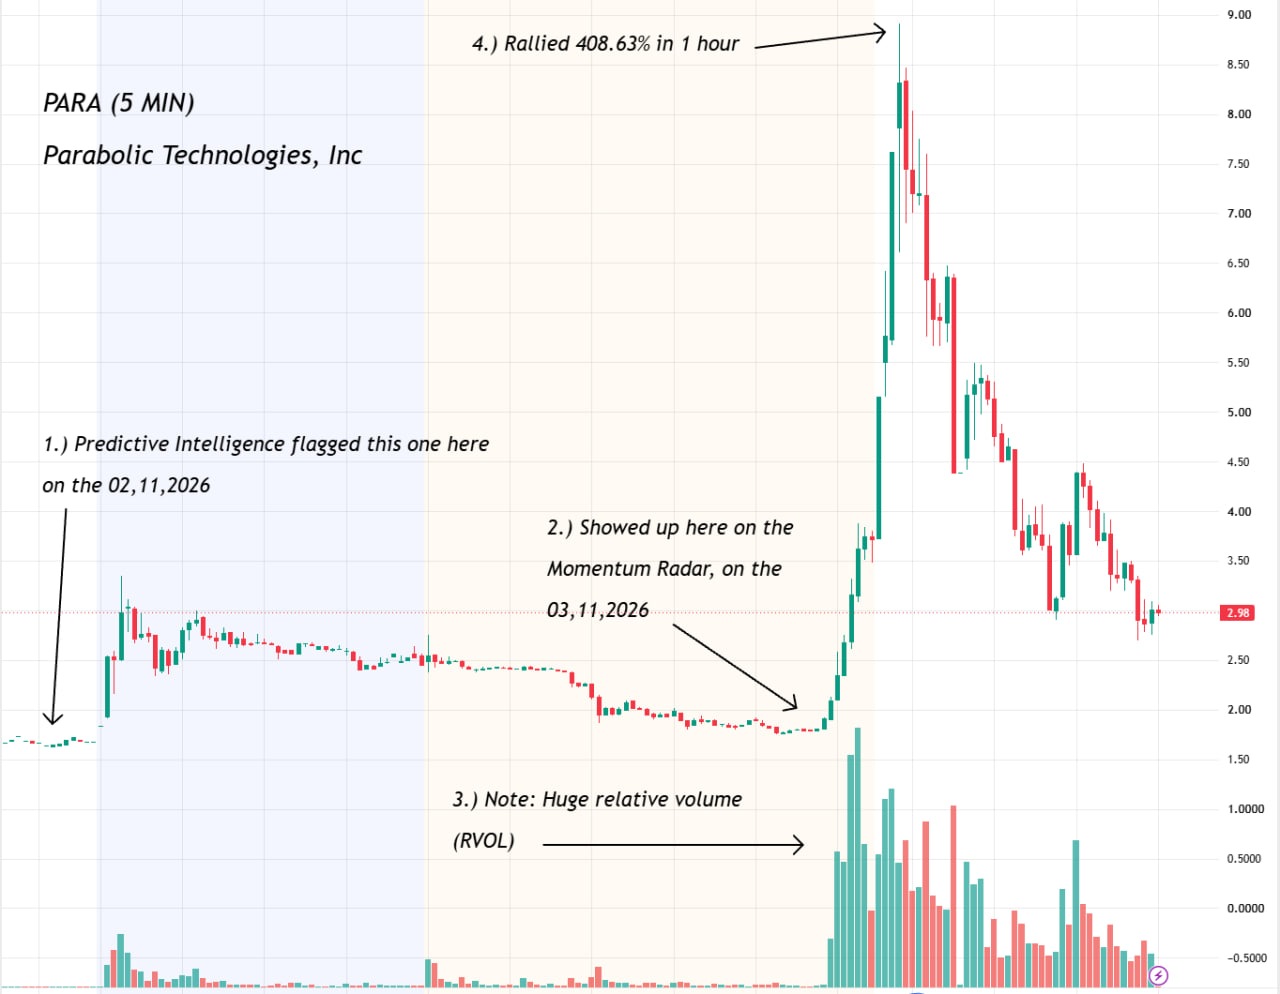
PARA
Parabolic Technologies
2–3 Nov 2026
WORKED FOR SCALPING
NO NEWS: HUGE RELATIVE VOLUME
 Click to enlarge
5-minute chart via TradingView. Annotations are mine.
- 2 Nov, 05:38 ET. An S-1 from Parabolic Technologies lands on the Predictive Intelligence ladder with an AI score of 10. The AI reads it as a routine filing with no substantive information about a structural event, timing or dilution, so there is no bullish or bearish tag and the score stays low.
- 3 Nov, early. No new activity, so the ladder score decays slightly overnight (−0.6 at 04:55 ET). There is no news.
- 3 Nov, end of pre-market. PARA shows up on the Momentum Radar and starts to run, on very high relative volume compared with its last 90 days.
- The move carries on into the official open and rallies +408.63% in about an hour, then sells off. The chart ends at about $2.98.
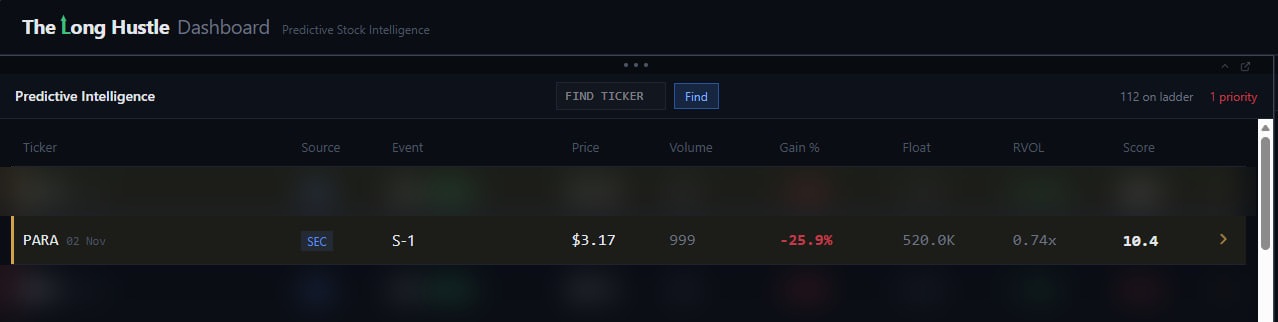
Predictive Intelligence: PARA on the ladder, dated 2 Nov, an S-1. The other tickers are blurred. This was captured at a different moment, so the price, volume and gain % here don’t match the Radar screenshot.
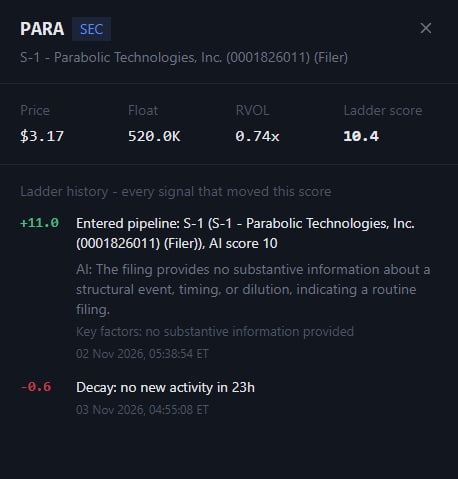
The ladder history for PARA: in on 2 Nov, 05:38 ET, with an AI score of 10, then a small decay on 3 Nov with no new activity.
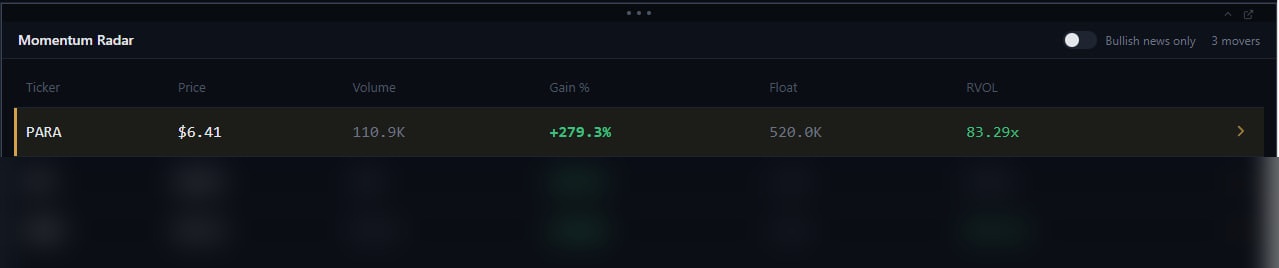
Momentum Radar, 3 Nov: PARA among the movers. The other tickers are blurred.
Like the others on this page, this one was caught while I was still building the software, before it went live on real-time data. The screenshots were captured at different moments, so the figures on them don’t match the chart or each other. The Radar shows +279.3% at $6.41 on 110.9K shares at the moment of capture, the Predictive row was captured later in the day at $3.17, and the chart shows the full +408.63% move. What they show is that PARA was on both scanners, and when.
What this shows: both scanners had it, and this one ran exceptionally well. Predictive Intelligence put PARA on the ladder on 2 Nov on an S-1 that the AI read as routine, so the score was low and there was nothing to get excited about on the filing alone. There was no news. What made the difference was relative volume. On 3 Nov the Momentum Radar picked it up at the end of pre-market with an RVOL of 83.29x and a float of just 520K, and very high relative volume compared with the last 90 days. It started running before the open, carried on into it, and rallied +408.63% in about an hour before it sold off. That is exactly why I don’t read either scanner on its own: a quiet filing and a loud tape can turn out to be the same stock. It earned its place in this column. This is a record of what the scanners showed, not a signal or a promise.
Matched on both scanners, but not a setup I would have traded, whether or not the stock moved.
CUPR
Cuprina Holdings (Cayman) Ltd
5–12 Oct 2026
WOULD NOT HAVE TRADED IT
IT WENT UP ANYWAY: +28.24%
 Click to enlarge
1-hour chart via TradingView. Annotations are mine.
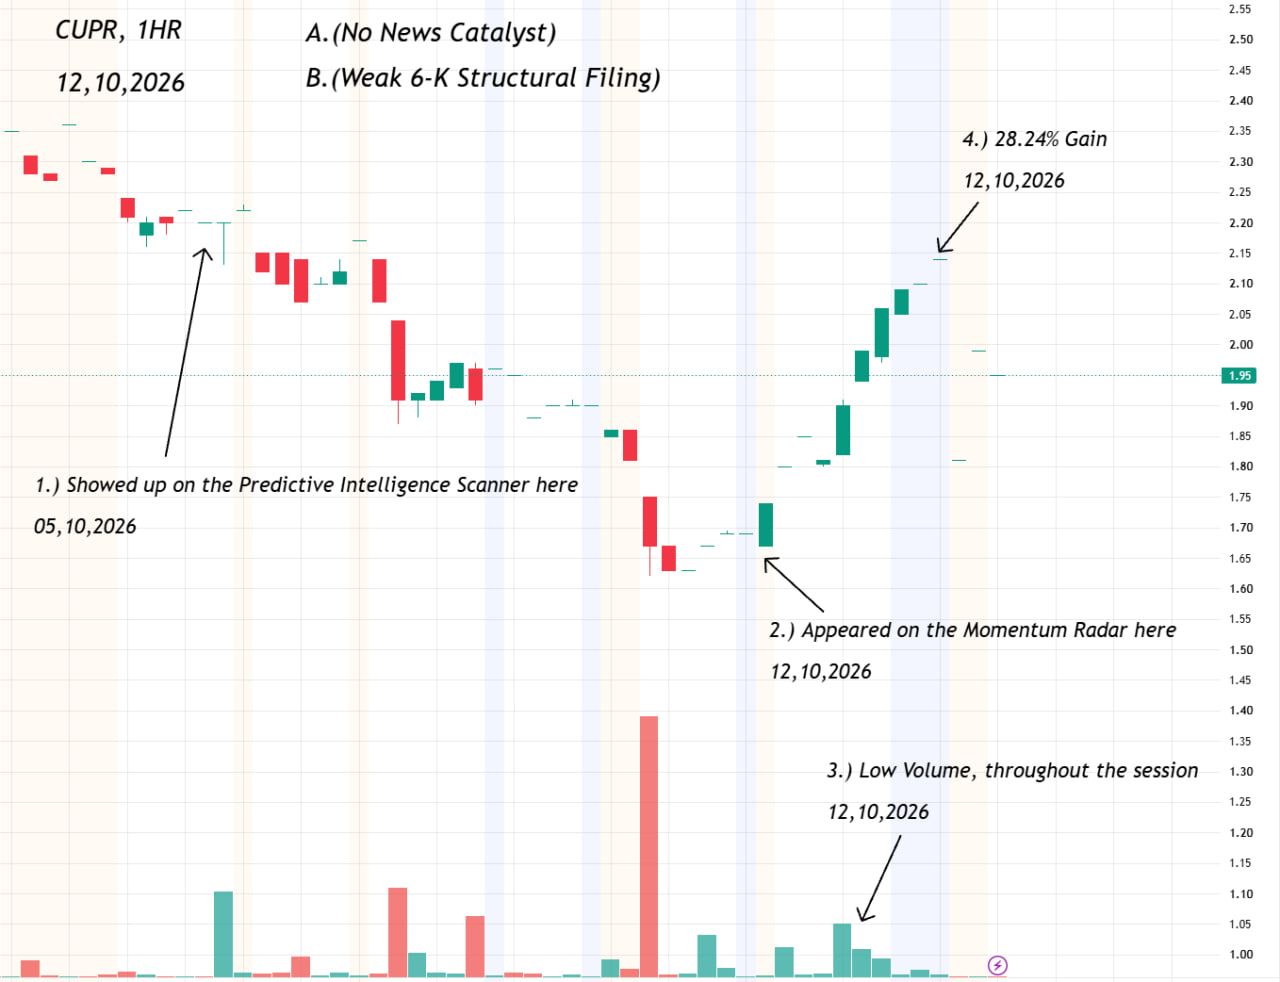
- 5 Oct, 15:48 ET. A 6-K from Cuprina Holdings (Cayman) lands on the Predictive Intelligence ladder with an AI score of 62.
- 6–12 Oct. Nothing new follows, and the ladder score decays a little every day.
- 12 Oct. CUPR starts climbing and shows up on the Momentum Radar.
- It climbs on very low volume, all session, with no news behind it.
- The move reaches +28.24%, but it takes the whole session to get there: regular hours as well as pre-market.

Predictive Intelligence: CUPR on the ladder, dated 05 Oct, event 6-K. This was captured later, so the price, volume and gain % here don’t match the Radar screenshot.
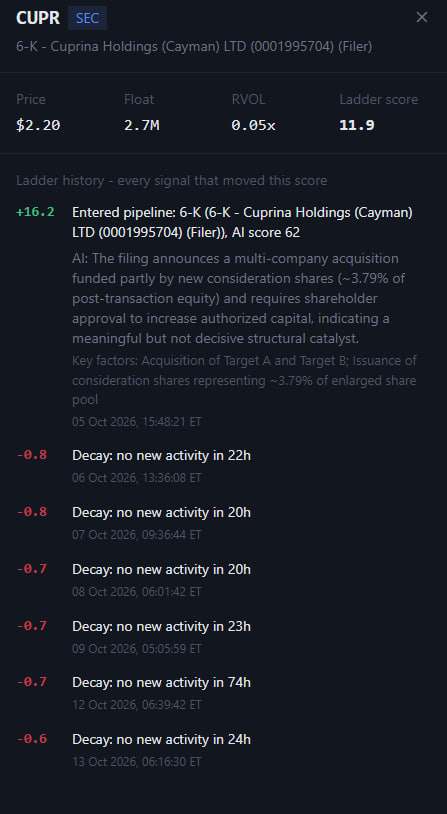
The ladder history for CUPR: in on 5 Oct with an AI score of 62, then decaying day after day with no new activity. The AI’s own verdict on the filing: “meaningful but not decisive structural catalyst.”
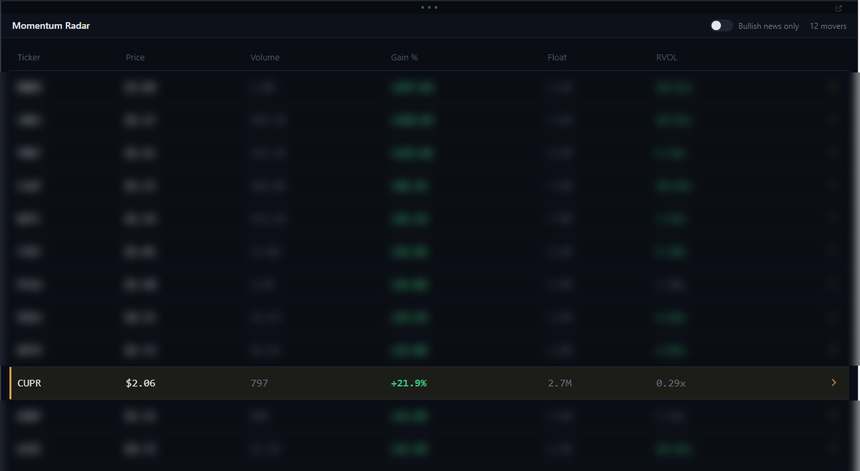
Momentum Radar, 12 Oct: CUPR among the movers. The other tickers are blurred. Look at the volume and RVOL columns.
Like the others on this page, this one was caught while I was still building the software, before it went live on real-time data. So the screenshots were captured at different moments and the price, gain % and volume on them don’t match from one to the next. The Radar shows +21.9% part-way through the move, the Predictive row was captured later and shows −9.1%, and the chart shows the full +28.24%. What they show is that CUPR was on both scanners, and when.
What this shows: the scanners did their job. Predictive Intelligence had CUPR a full week before it showed up on the Momentum Radar, and the stock did go up 28.24%. It sits on this side anyway, for full transparency, because I would not have traded it. Here is why:
- Thin volume. It went up on very low volume throughout the whole session. The Radar shows 797 shares and an RVOL of 0.29x. A move with that little behind it is one I don’t trust.
- No news catalyst. Nothing explained the move.
- A weak filing. The 6-K was an acquisition funded partly by new consideration shares (about 3.79% of post-transaction equity), with shareholder approval needed to increase authorised capital. The AI called it “meaningful but not decisive.” That is not enough to build a trade on.
- The wrong shape. The 28.24% took the whole session to build, regular hours and pre-market. You could have made money on it as a day trade, but that is not the quick burst I look for in a scalp.
So it ran, but not the way I trade, and it stays on this side. A stock going up is not the same as a setup working. This is a record of what the scanners showed and why I would have passed, not a signal or a promise.
SPRC
SciSparc Ltd
23–26 Oct 2026
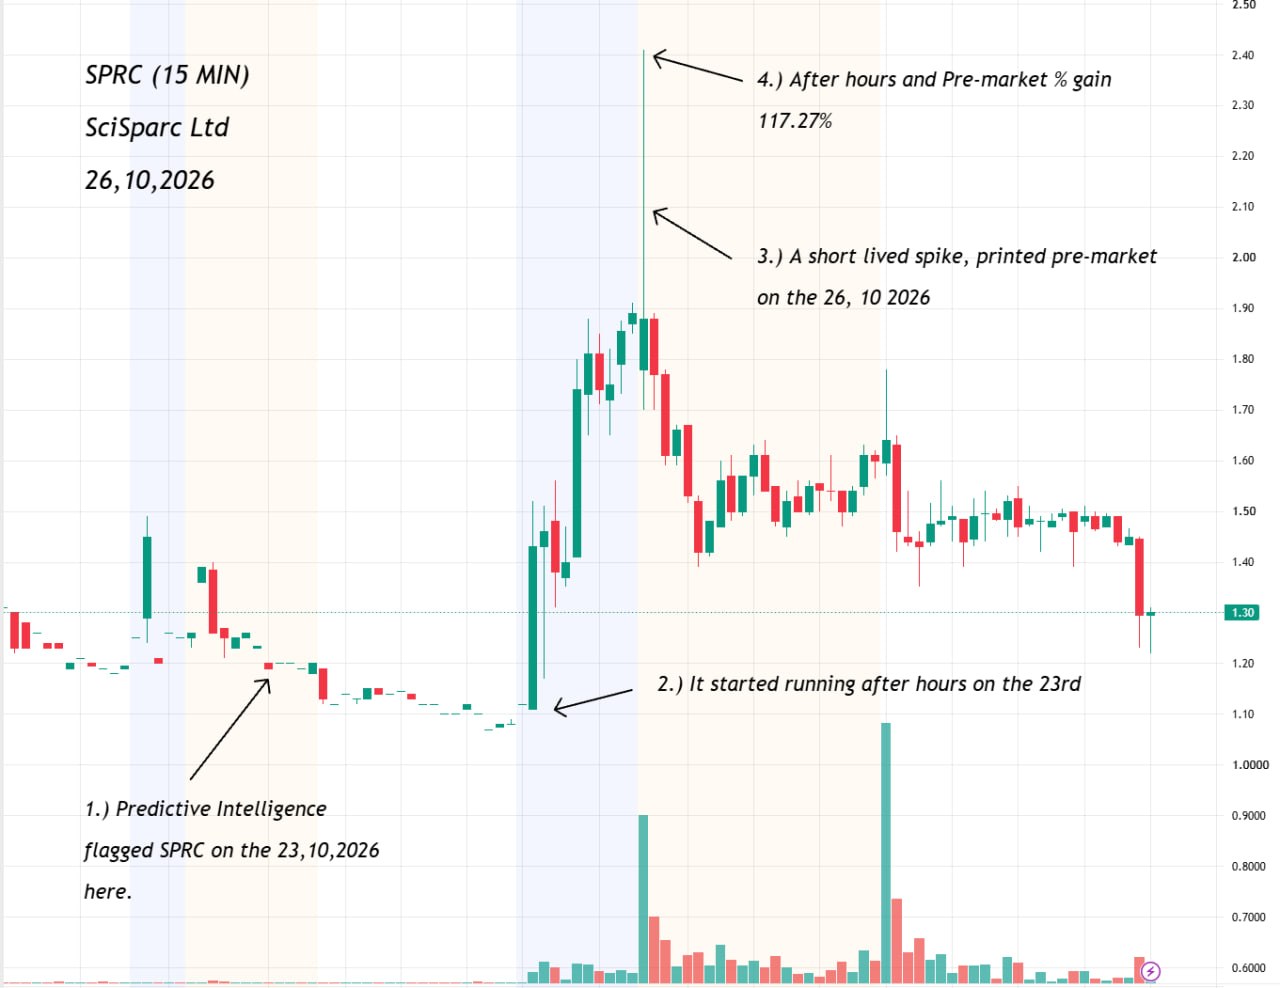
TOO HARD TO SCALP IN PRE-MARKET
IT RAN +117.27% AFTER HOURS AND PRE-MARKET
 Click to enlarge
15-minute chart via TradingView. Annotations are mine.
- 23 Oct. A new 6-K from SciSparc lands on the Predictive Intelligence ladder with an AI score of 35. The filing announces a convertible note, which the AI reads as bearish. (SPRC was also on the ladder earlier, from 7 Oct, and is in the “what worked” column for its 15 Oct run. This is a different run on the same ticker.)
- 23 Oct, after hours. SPRC starts running. That is outside the pre-market window I trade.
- 26 Oct, pre-market. With no news that day, SPRC shows up on the Momentum Radar as it passes 20%. A short-lived spike prints, and it fades almost straight away.
- The chart ends at about $1.30.
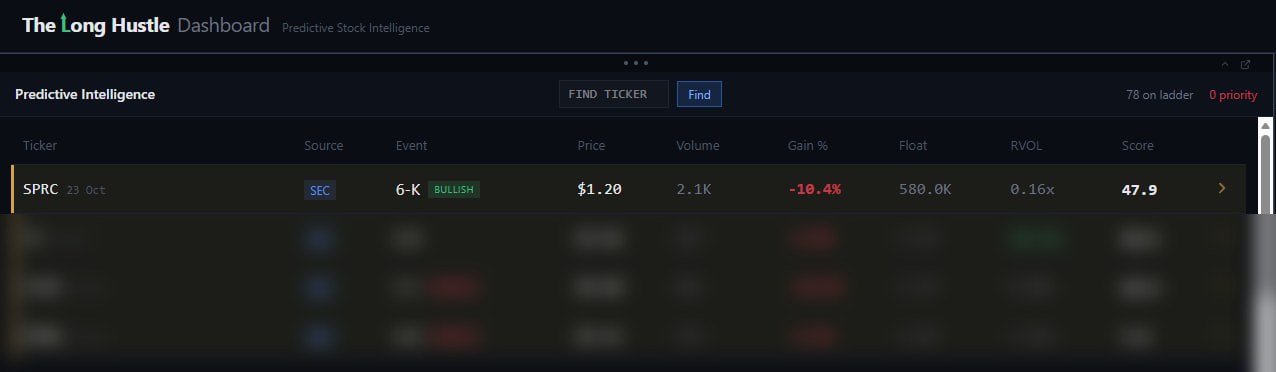
Predictive Intelligence: SPRC on the ladder, dated 23 Oct, event 6-K. The other tickers are blurred. This was captured later, so the price, volume and gain % here don’t match the Radar screenshot.
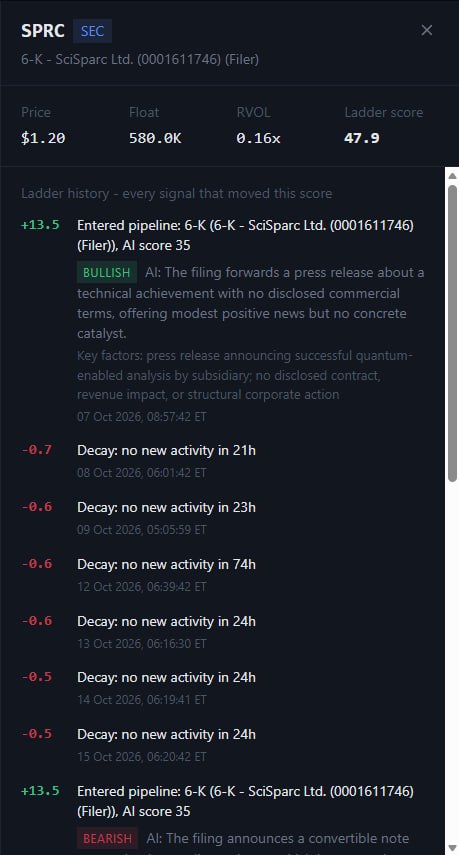
The ladder history for SPRC: two entries. The first, on 7 Oct, was read as bullish and then decayed. The second is the new 6-K, which the AI read as bearish: it announces a convertible note.

Momentum Radar, 26 Oct: SPRC among the movers. The other ticker is blurred.
Like the others on this page, this one was caught while I was still building the software, before it went live on real-time data. So the screenshots were captured at different moments, and the price, gain %, volume and RVOL on them don’t match from one to the next. The Radar shows +45.9% at $1.59, the Predictive row was captured later and shows −10.4% at $1.20, and the chart shows the full +117.27% across after hours and pre-market. What they show is that SPRC was on both scanners, and when.
What this shows: the scanners did their job. Predictive Intelligence had SPRC on the ladder on 23 Oct, before the run, and the Momentum Radar picked it up on 26 Oct as it passed 20%. The stock went up a total of 117.27% across after hours and pre-market. It sits on this side anyway, for full transparency, because trading it in pre-market, which is what I do and what The Long Hustle is built around, would have been very hard. Here is why:
- It started after hours. The run began on the 23rd, outside the pre-market window. By the time it was on the Radar in pre-market, a lot of the move had already happened.
- The pre-market spike was very short-lived. The Radar flagged it when it passed 20%, but it printed and faded almost at once. There was not enough there to scalp.
- No news in the session. There was news on 22 Oct, but nothing fresh on the day, so there was no catalyst that fits my criteria.
- The headline number flatters it. The +117.27% is measured across after hours and pre-market together. It is not what a pre-market trader could have captured.
So the scanners flagged it, and you could argue it did its job. But it would have been too hard to scalp, and I want to be as transparent as possible, which is why it belongs in this column. A stock going up is not the same as a setup working. This is a record of what the scanners showed and why I would have passed, not a signal or a promise.
POAS
Phaos Technology Holdings Ltd
27–30 Oct 2026
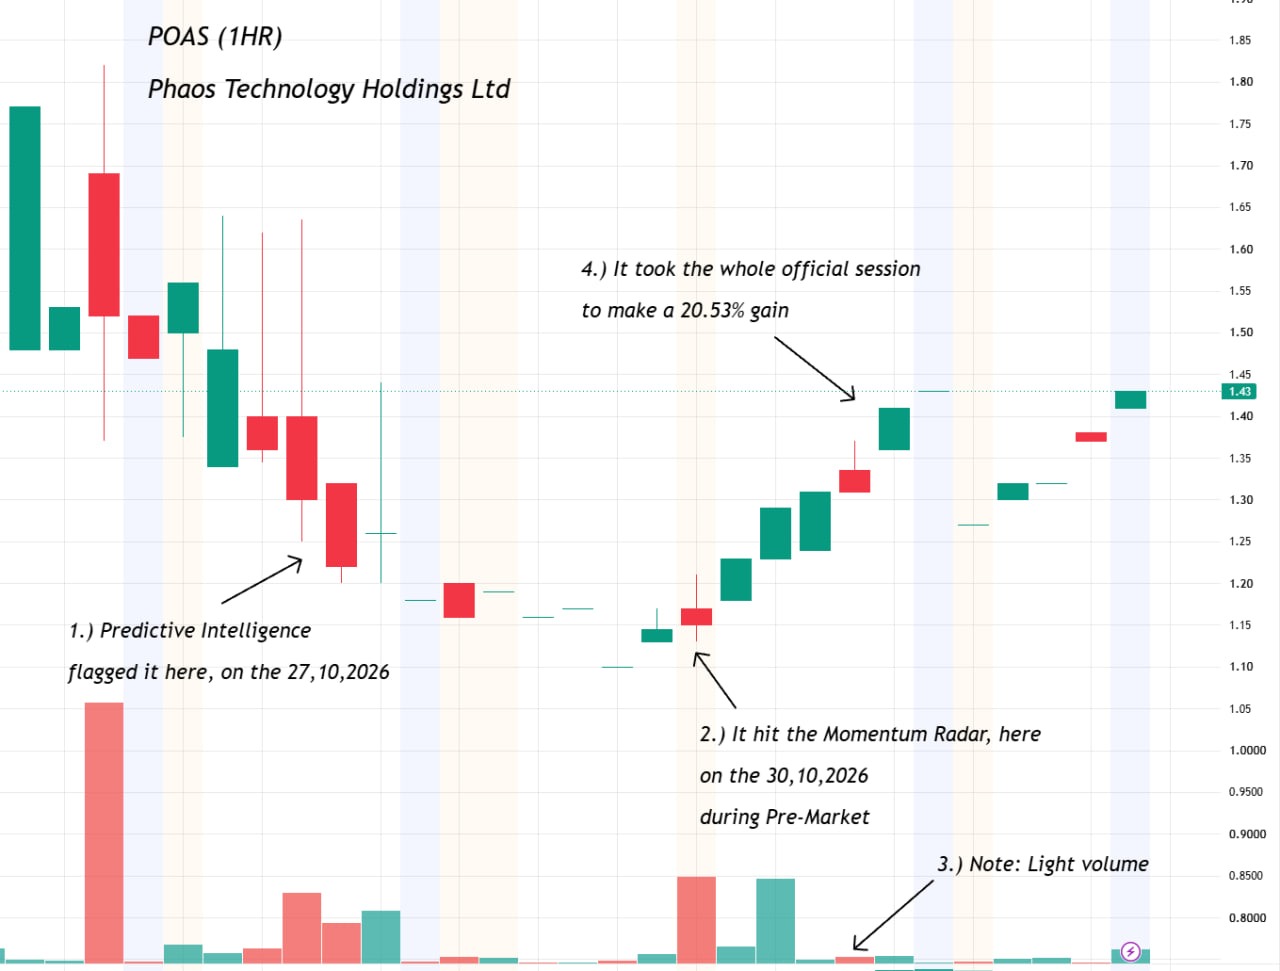
NOT A SCALP: A SLOW GRIND
+20.53% OVER THE WHOLE OFFICIAL SESSION
 Click to enlarge
1-hour chart via TradingView. Annotations are mine.
- 27 Oct, 06:06 ET. A 6-K from Phaos Technology Holdings lands on the Predictive Intelligence ladder with an AI score of 15. The AI reads it as bearish: the filing only forwards a press release disclosing a required going-concern warning, with no actionable catalyst.
- 29–30 Oct. With no new activity on the ladder, the score decays a little each day, ending at 10.4.
- 30 Oct, pre-market. With no news, POAS appears on the Momentum Radar. It is on both scanners.
- 30 Oct, official session. POAS grinds higher on light volume and takes the whole official session to make a gain of 20.53%. The chart ends at about $1.43.

Predictive Intelligence: POAS on the ladder, dated 27 Oct, event 6-K. Bullish and bearish describe the tone of the filing, not a prediction of price.
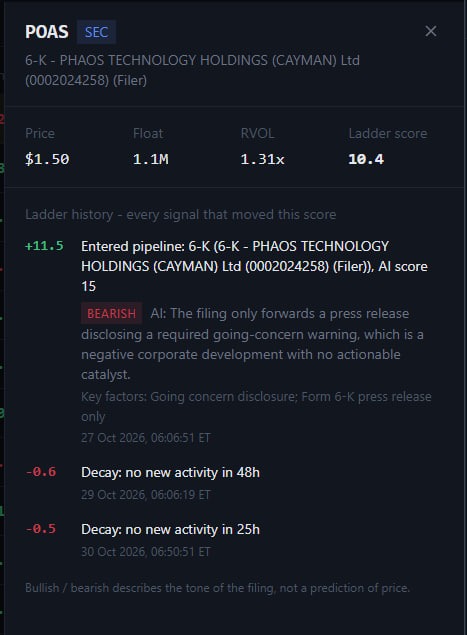
The ladder history for POAS: the 6-K entered the pipeline on 27 Oct, then the score decayed on 29 and 30 Oct with no new activity.
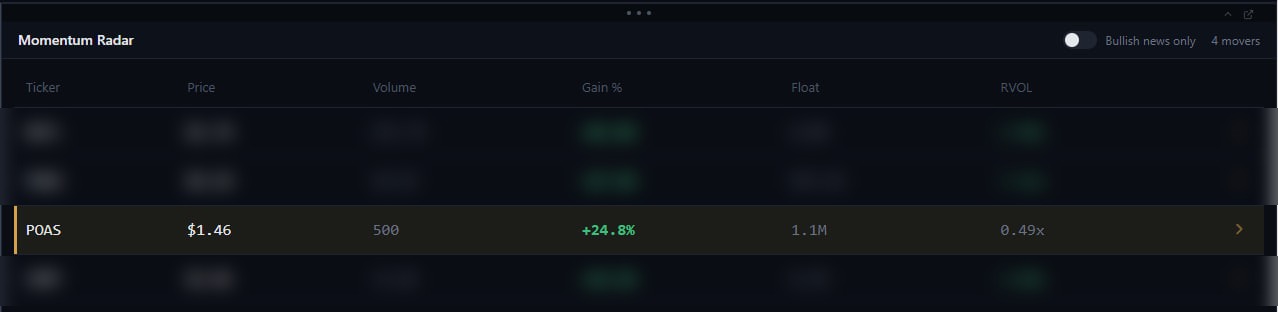
Momentum Radar, 30 Oct: POAS among the movers. The other tickers are blurred.
Like the others on this page, this one was caught while I was still building the software, before it went live on real-time data. So the screenshots were captured at different moments, and the price, gain % and RVOL on them don’t match from one to the next. The Radar shows +24.8% at $1.46, the Predictive row shows −22.3% at $1.50, and the chart shows the +20.53% gain across the official session. What they show is that POAS was on both scanners, and when.
What this shows: the scanners did their job. Predictive Intelligence had POAS on the ladder on 27 Oct, and the Momentum Radar picked it up in pre-market on 30 Oct. The stock did go up, by 20.53%. It sits on this side anyway, for full transparency, because it would not have met my criteria for a pre-market trade. It qualified for the scanners, which is why it flagged on both, but it wasn’t a scalp setup I would have taken. Here is why:
- It took the whole official session. The whole of the official session, hours, just to make 20.53%. That is far too slow for the scalping The Long Hustle is built around.
- It was a grinder on low volume. Volume stayed light throughout the day, so there was no burst of momentum to trade.
- No news. There was no catalyst on the day. The only filing was a 6-K that the AI read as bearish.
- It could have worked as a different kind of trade. A day trade held through the whole session would have made money. It would have taken hours, and it is not how I personally trade.
So the scanners flagged it, it went up, and you could say it worked. But it wasn’t a setup I would have taken, and I want to be as transparent as possible, which is why it belongs in this column. A stock going up is not the same as a setup that suits your strategy. This is a record of what the scanners showed and why I would have passed, not a signal or a promise.
How This Page Works
- A ticker is included if it appeared on both scanners, whatever happened afterwards
- Percentages are read from the chart the way a broker shows them (from the after-hours session, rolling into pre-market), not from the low of the day
- Every entry shows the date, so you can check it against the charts yourself
- "Worked" means it gave a scalper a 20%+ move to trade. I also show what happened afterwards, because holding it would have been a different result
- "Didn’t work" doesn’t always mean the stock fell. It means the setup was not one I would have traded, for example a move on thin volume with no news, or one that grinds up over the whole session instead of bursting. Those go on the right side too
- "Didn't work" means it appeared on both scanners but barely got above 20%, or never gave a clean 20%+ move, and fizzled out. Those go in the right-hand column, shown with the same detail as the winners
- This is a record of what happened, not a promise of what will happen next